


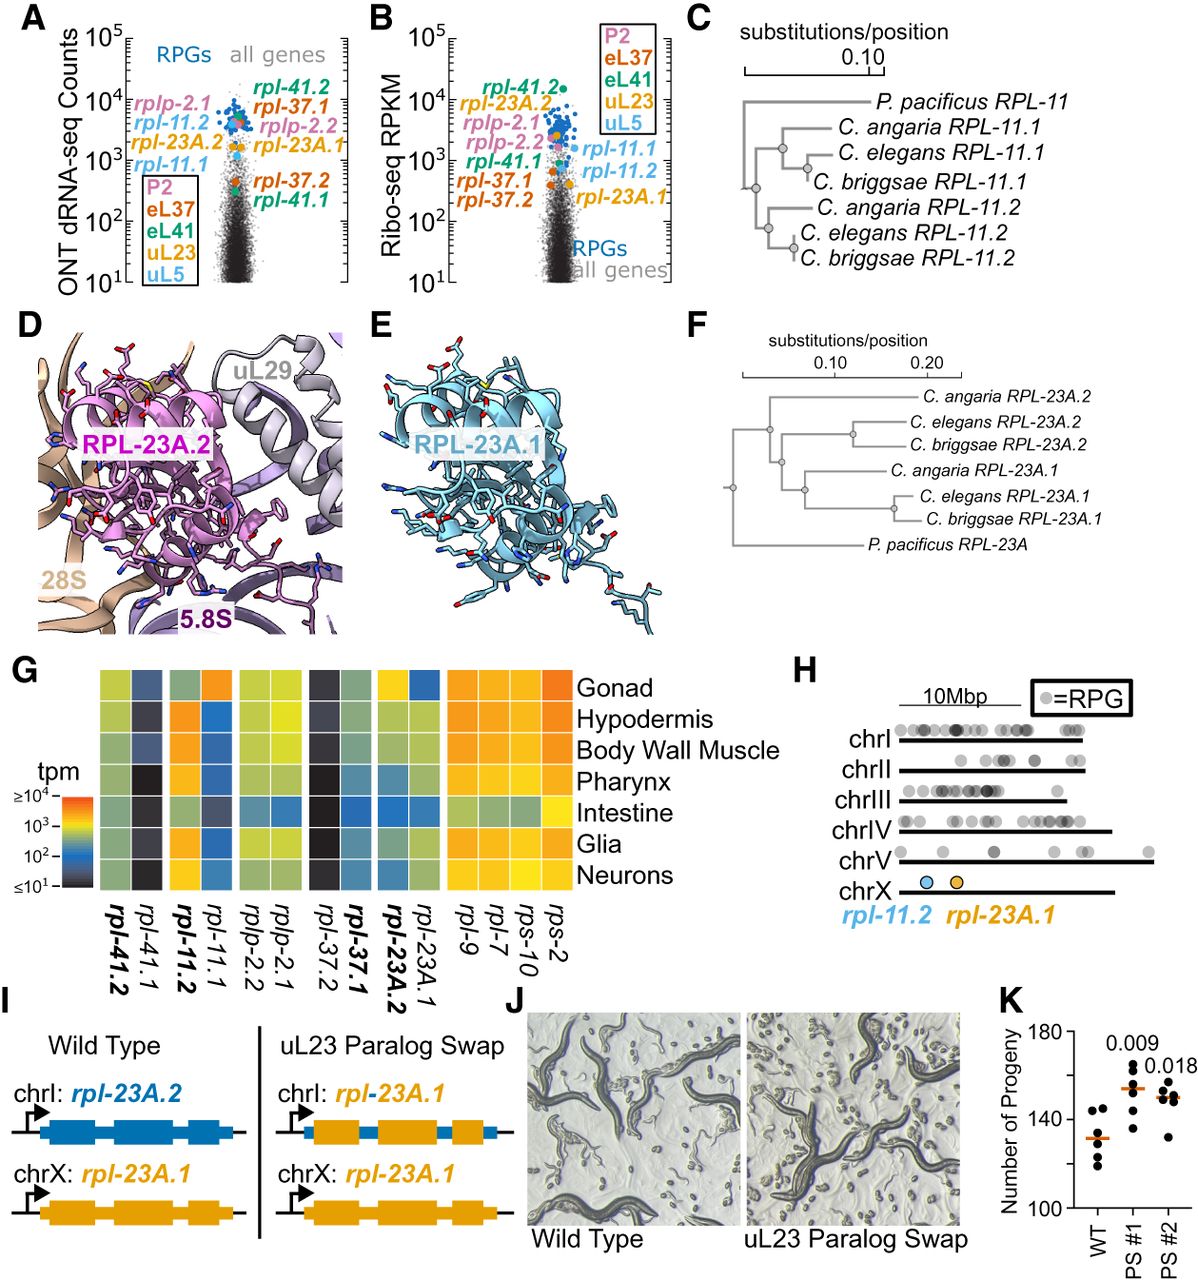
C. elegans uL5 and uL23 are encoded by tissue-specific paralogs. (A and B) Expression data as in Figure 4C,D, re-colored to indicate the ribosomal proteins with paralogs. (C) Conservation of uL5 paralogs throughout Caenorhabditis. C. briggsae, C. angaria, and C. elegans are three representative Caenorhabditis species, and P. pacificus (a more distantly related nematode) is an outgroup. Phylogenetic tree made with CLUSTAL Omega. (D) RPL-23A.2 within the C. elegans ribosome structure, with all side chains shown, colored by heteroatom. (E) AlphaFold model of RPL-23A.1 with side chains shown in the same orientation as RPL-23A.2. Note the conservation of side chains that contact nearby rRNA and uL29 sites in the ribosome. (F) As in C, but with uL23 paralogs. (G) Heatmap of mRNA expression from single-cell RNA-seq from L2 animals, binned by tissue. Four constitutive, nonparalogous ribosomal proteins are shown for reference (rps-2, rps-10, rpl-7, rpl-9). The remaining ribosomal proteins are presented in pairs, with the bold gene encoding the protein most present in our map; tpm, transcripts per million. The low counts for rpl-37.1/2 and rpl-41.1/2 are likely an artifact of their high nucleotide identity, leading to multimapping reads that are filtered in the scRNA-seq pipeline (Cao et al. 2017). (H) Genomic location of ribosomal protein genes. Each gray dot represents the position of a single ribosomal protein gene in the genome. Soma-specific paralogs on the X-chromosome are indicated. (I) Schematic of paralog swap experiment. WT animals contain rpl-23A.2 (blue) on chromosome one and rpl-23A.1 (orange) on the X-chrosome. In “uL23 Paralog Swap” animals, the coding sequence of the rpl-23A.2 gene has been mutated to that of rpl-23A.1 (orange) while preserving the noncoding sequences of rpl-23A.2 (blue). (J) Photographs of WT and uL23 paralog swap animals. (K) Brood size analysis of WT and uL23 paralog swap (PS) animals. Two independently derived isolates of the rpl-23A.2 gene replacement were tested, “#1” and “#2.” Each dot represents a single animal; average of that strain is given by the red line. Note the y-axis scale starts at 100. P-value from Welch's t-test for comparison with WT.




