


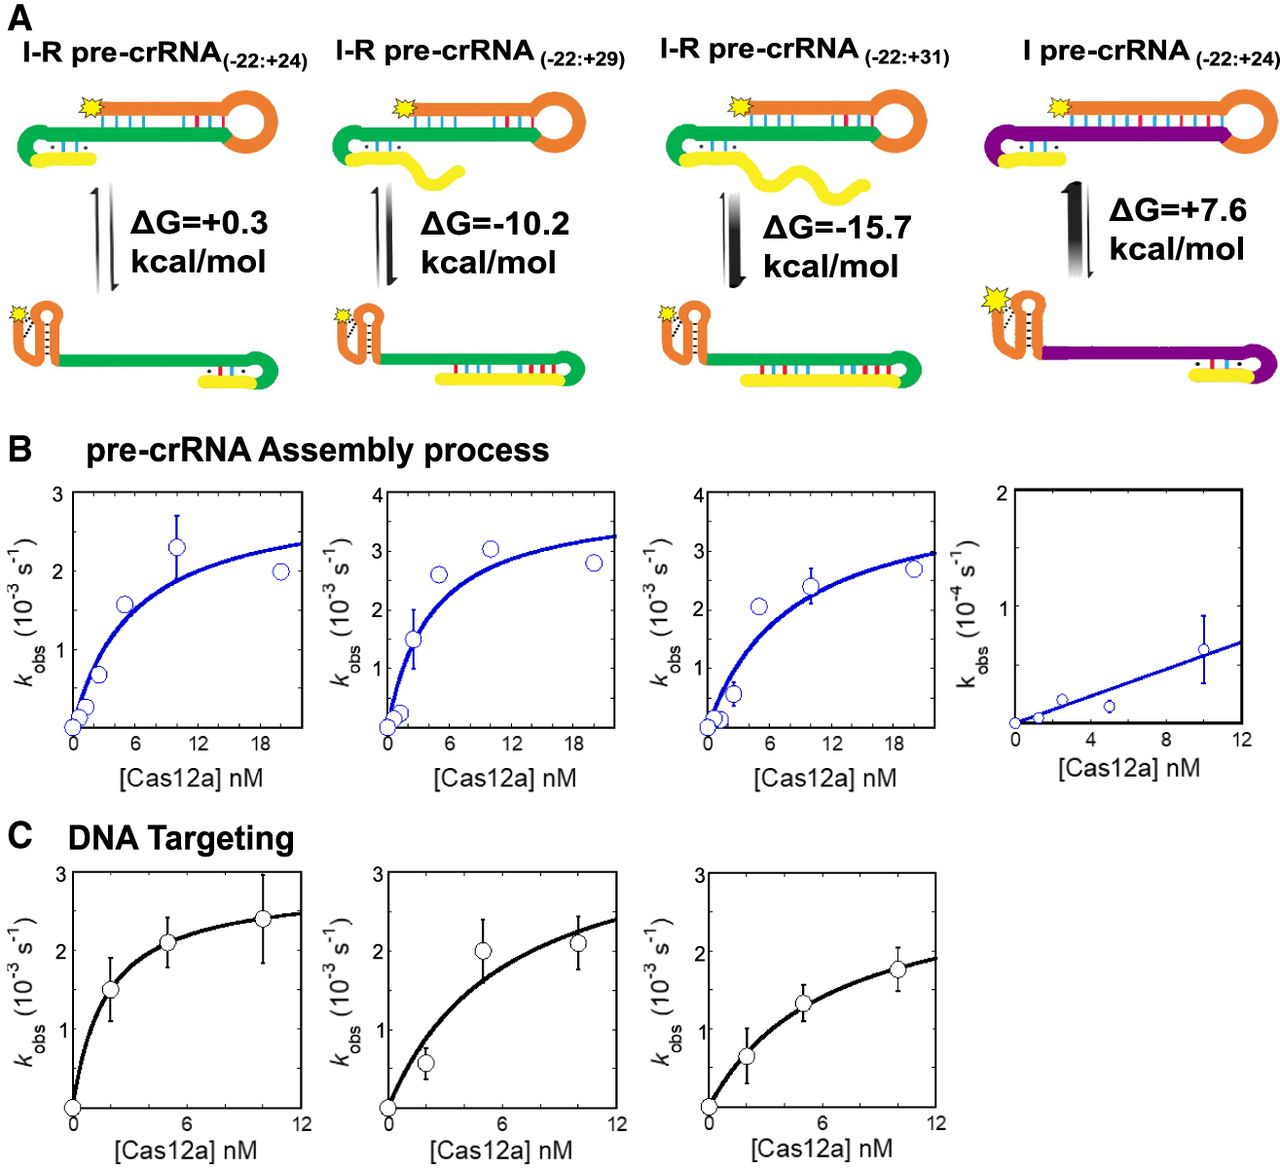
Pre-crRNA misfolding and rescue by downstream secondary structure. (A) Schematics showing alternative secondary structures and corresponding predicted free energy differences (Serra and Turner 1995). See Supplemental Figure S1 for pre-crRNA sequences. (B) Cas12a assembly kinetics. Rate constants were measured by following pre-crRNA processing using the indicated Cas12a concentrations and trace radiolabeled pre-crRNA. Each plot shows results from the corresponding pre-crRNA above it. Data are shown as the average ± SEM of three independent measurements and are fit by a hyperbola to give kon values (left to right) of 5.6 (±0.1) × 105 M−1 sec−1, 9.8 (±0.5) × 105 M−1 sec−1, 6.4 (±0.1) × 105 M−1 sec−1, and 6.8 (±0.8) × 103 M−1 sec−1. The maximal rate constants for the I-R constructs were (left to right) 2.9 (±0.6) × 10−3 sec−1, 3.8 (±0.7) × 10−3 sec−1, and 4.1 (±1.0) × 10−3 sec−1. (C) Kinetics of DNA targeting. Rate constants were measured by following cleavage of radiolabeled NTS at the indicated Cas12a concentrations. Data were fit by a hyperbola to give the DNA binding and NTS cleavage rate constants. Each plot shows results from the corresponding pre-crRNA above it. The pre-crRNA at the right was not measured for DNA binding because it blocked Cas12a assembly of the pre-cRNA. Second-order rate constants were (left to right) 1.6 (±0.4) × 106 M−1 sec−1, 4.8 (±0.6) × 105 M−1 sec−1, and 2.5 (±0.1) × 105 M−1 sec−1 (average ± SEM from three independent experiments).




