


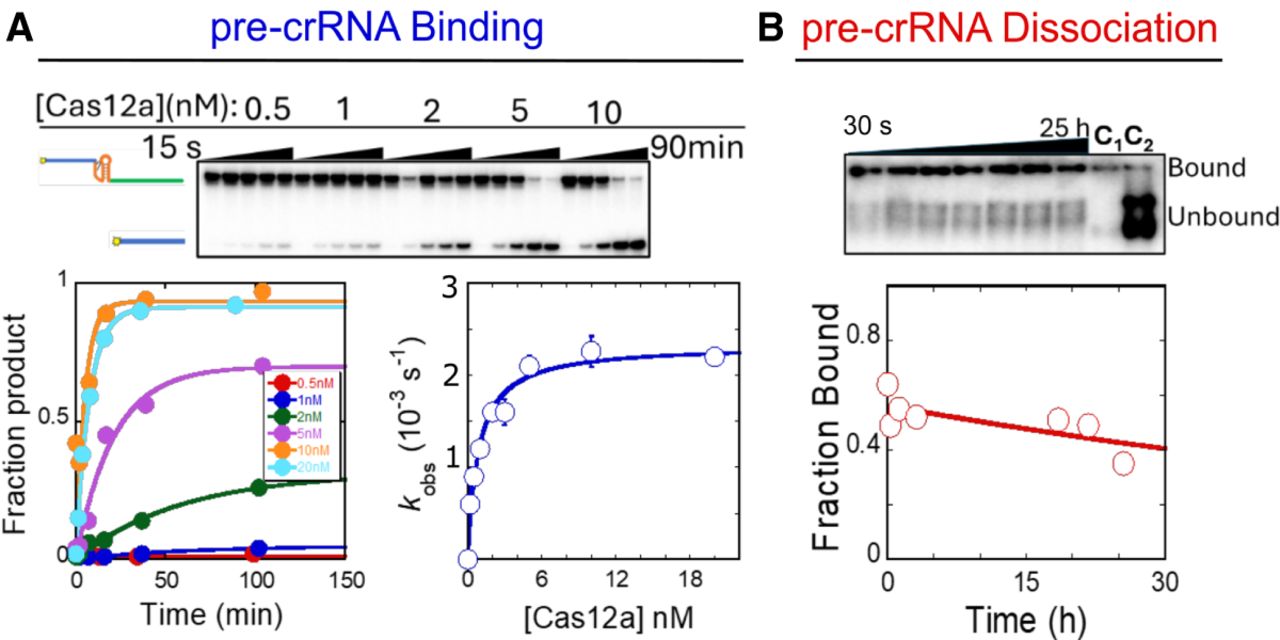
Cas12a binding and dissociation of pre-crRNA−34:+24. (A) Binding and pre-crRNA cleavage kinetics. The top image shows a representative gel, with the indicated Cas12a concentrations, trace radiolabeled pre-crRNA−34:+24, and time points from 30 sec to 90 min. Data from the gel are shown as time courses with fits by pseudo-first-order rate equations (lower left), and observed rate constants from these and additional experiments are plotted against Cas12a concentration to give the second-order rate constant and maximal first-order rate constant indicated from a fit by a hyperbolic equation (lower right). The value of kon was 2.9 (±0.2) × 106 M−1 sec−1, reflecting the average and SEM of fits to data from three independent experiments. (B) Dissociation kinetics. Trace radiolabeled −19d,pre-crRNA−34:+24 was bound to Cas12a and chased off a 10-fold excess of unlabeled −19d,pre-crRNA−34:+24. The additional bands visible just above the free substrate in the gel image (top) were consistently observed in the presence of the chase oligonucleotide and probably reflect fortuitous interactions of two molecules of −19d,pre-crRNA−34:+24. The lane C1 shows a reaction performed in the absence of chase oligonucleotide. The lane C2 shows a reaction in which the labeled and unlabeled pre-crRNA was mixed together and then added to Cas12a. The plot (bottom) shows results from the gel image, with the best fit by a first-order rate equation. The value of koff was 1.6 (±0.5) × 10−6 sec−1, reflecting the average and SEM of fits to data from five independent experiments.




