


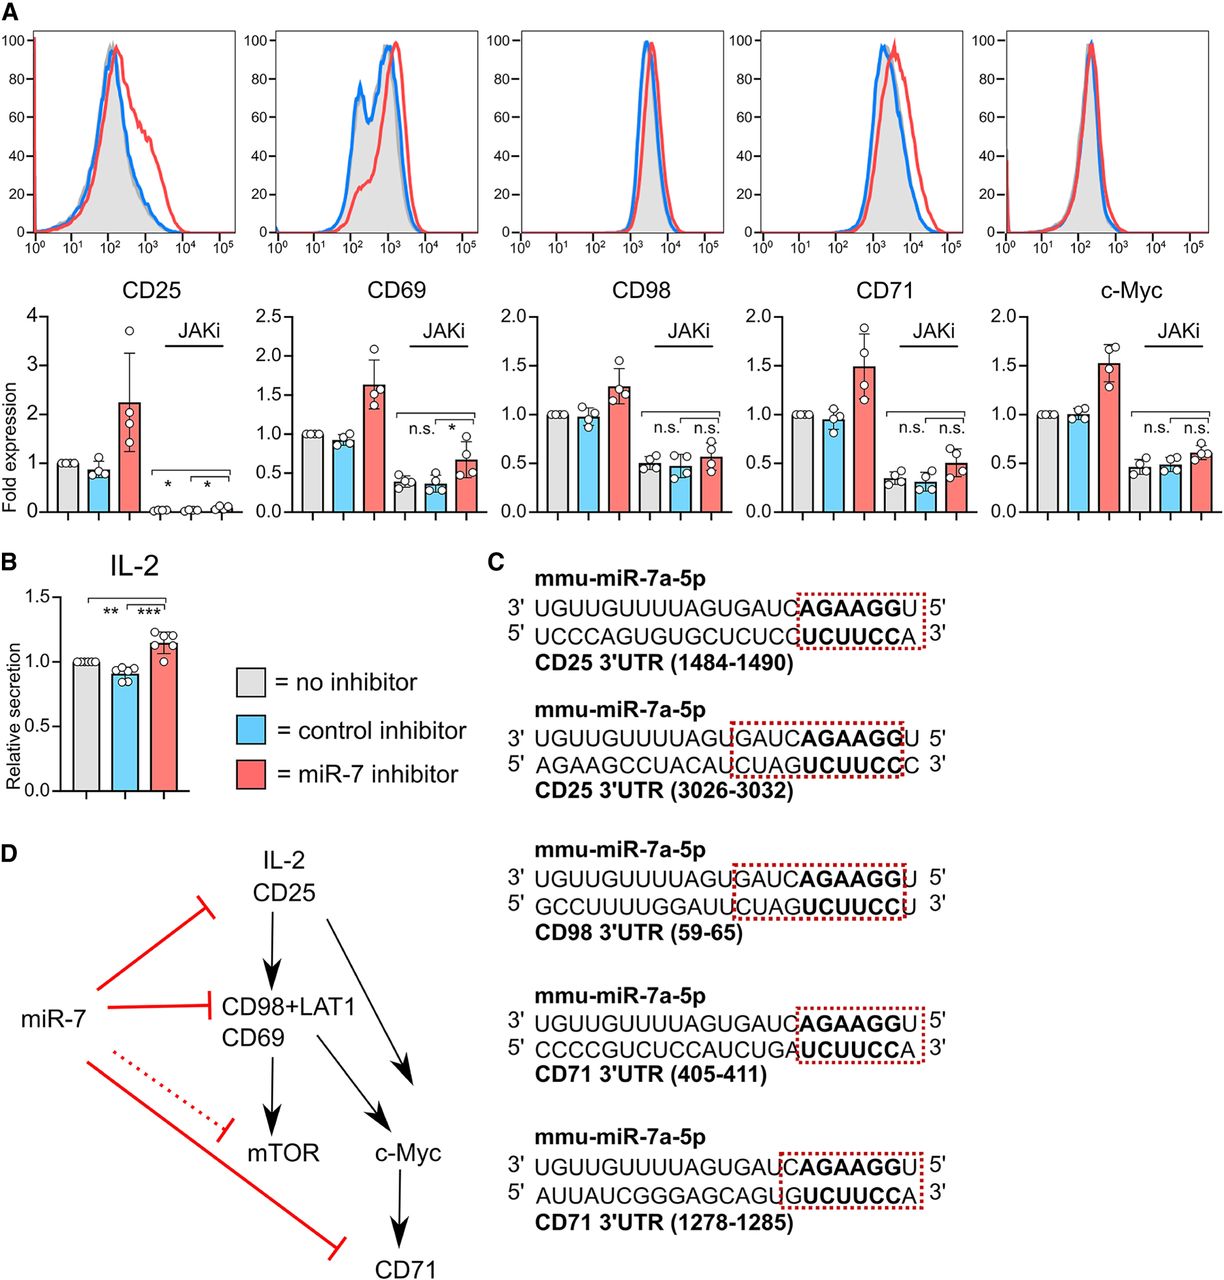
Blockade of JAK signaling partially abrogates miR-7 inhibition. (A) Cells were activated with SIINFEKL peptide ± miR-7 or control inhibitor. Additionally JAK inhibitor (tofacitinib) was added on d1. Expression of surface markers and transcription factors was measured on d2. Representative flow cytometry histograms are shown with pooled data from four independent experiments. Minus JAK inhibitor data are reprised from Figure 3. Fold expression calculated from the median fluorescence index is shown relative to “no miRNA inhibitor” control. Statistical analysis was performed using a one-way ANOVA with Tukey's multiple comparisons test, to compare the JAK inhibitor treated conditions. (B) IL-2 secreted on d1, measured by ELISA from culture supernatants. IL-2 receptor blocking antibody was included in cultures to prevent uptake and depletion of IL-2 by the T cells. The graph is showing six biological replicates from three independent experiments, as IL-2 secretion (measured in pg/mL from culture supernatant) relative to “no inhibitor” control. Statistical analysis was performed using a one-sample t-test to compare “miR-7 inhibitor” to the hypothetical mean of 1 and a two-tailed unpaired student's t-test to compare “control inhibitor” and “miR-7 inhibitor” conditions. (C) miR-7 target site location in 3′UTR of CD25, CD98, and CD71. A six-mer seed site is shown in bold and other complementary nucleotides are shown within the red square. (D) Schematic of proposed mechanism of action of miR-7 in CD8+ T cells.




