


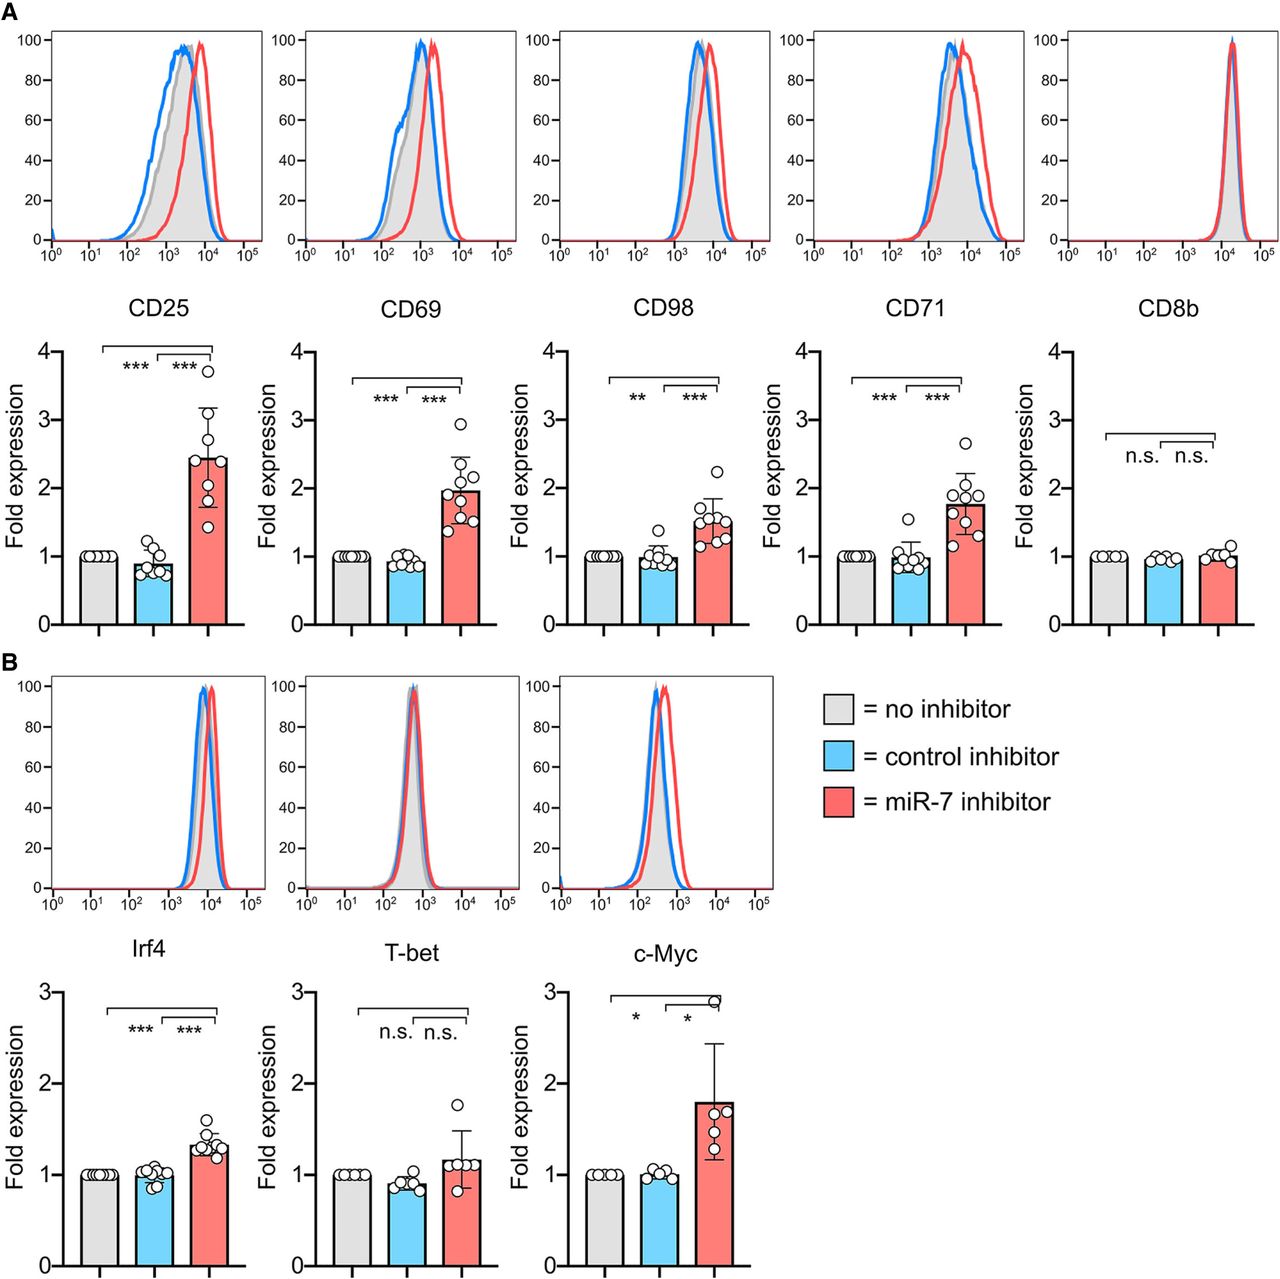
Inhibition of miR-7 during T-cell activation results in altered cell phenotype. (A,B) Cells were activated with SIINFEKL peptide in the presence of miR-7 inhibitor and expression of surface markers (A) and transcription factors (B) was measured on d2. Representative flow cytometry histograms are shown with graphs showing individual biological replicates pooled from 4–6 independent experiments, with “fold expression” calculated from the median fluorescence index and shown relative to “no inhibitor” control. Statistical analysis was performed using a one-sample t-test to compare “miR-7 inhibitor” to the hypothetical mean of 1 and a two-tailed unpaired student's t-test to compare “control inhibitor” and “miR-7 inhibitor” conditions.




