


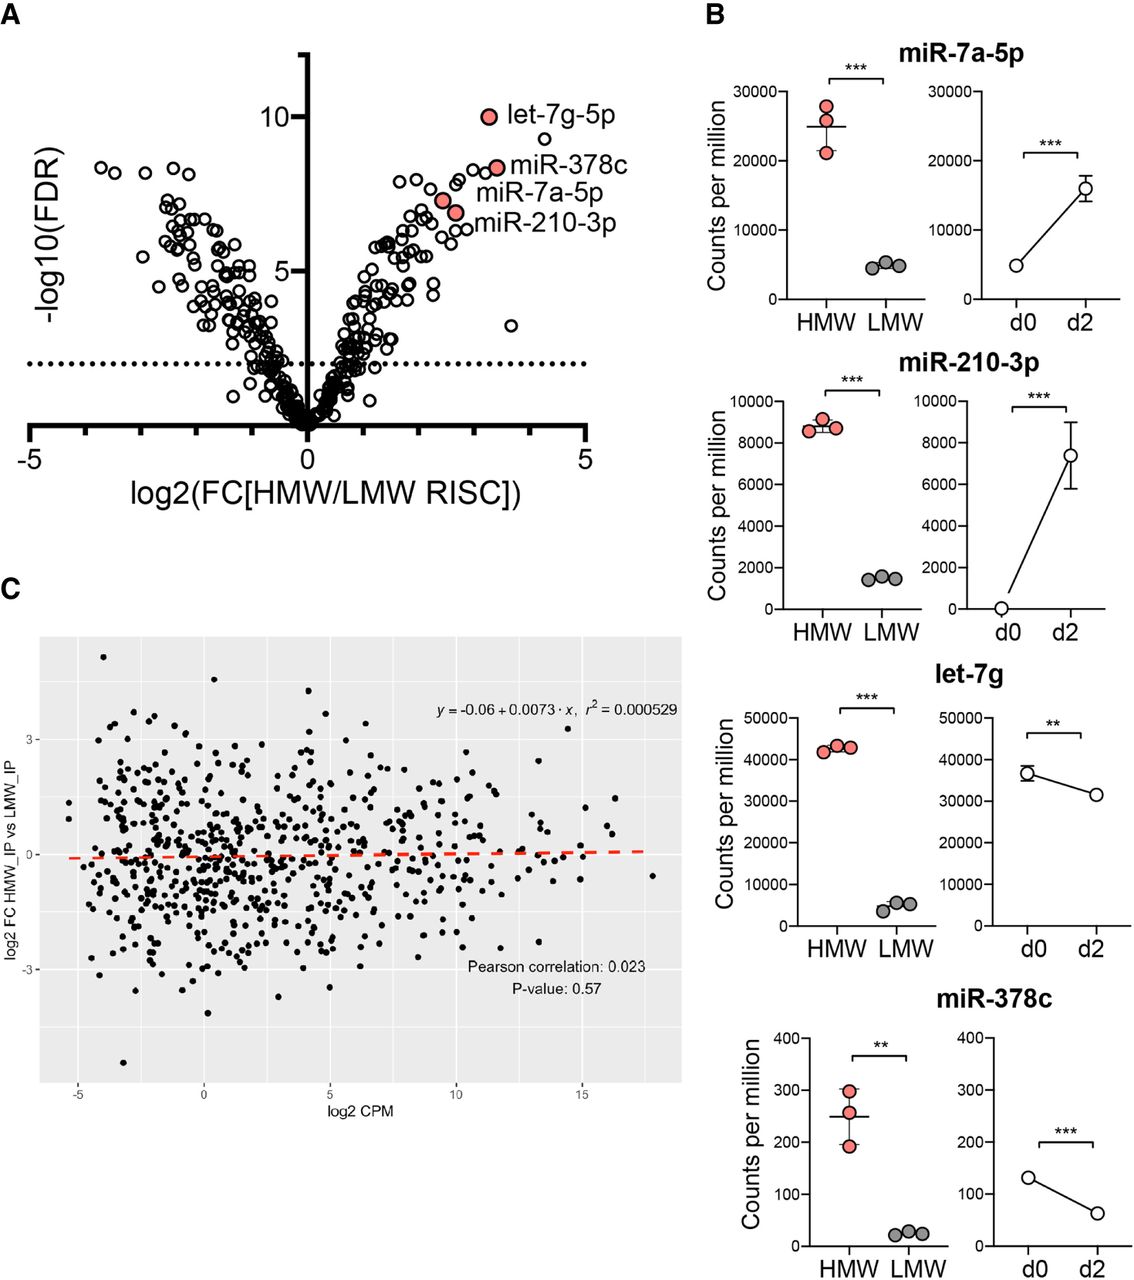
Specific miRNAs are found significantly enriched in HMW RISC in activated CD8+ T cells. (A) Differential expression of miRNAs between HMW and LMW RISC shown in a volcano plot of log2 fold change expression in HMW versus LMW RISC and −log10 of false discovery rate. Significant differences (FDR < 0.01) are above the dashed line. (B) Counts per million (CPM) of miRNAs in HMW and LMW RISC in d2 activated cells. Expression change is shown as CPM in Ago2 IP from naïve d0 and d2 activated cells. Data are from three biological replicates in one experiment. Statistical analysis was performed using a two-tailed unpaired student's t-test (*** P < 0.01, ** P < 0.05). (C) Partitioning of miRNAs in HMW RISC is not correlated with total expression levels of miRNAs based on Pearson correlation. Y-axis shows the log2 fold change of miRNA read counts in HMW IP versus LMW IP libraries and X-axis is the log2 counts per million (using the data described in A and B).




