


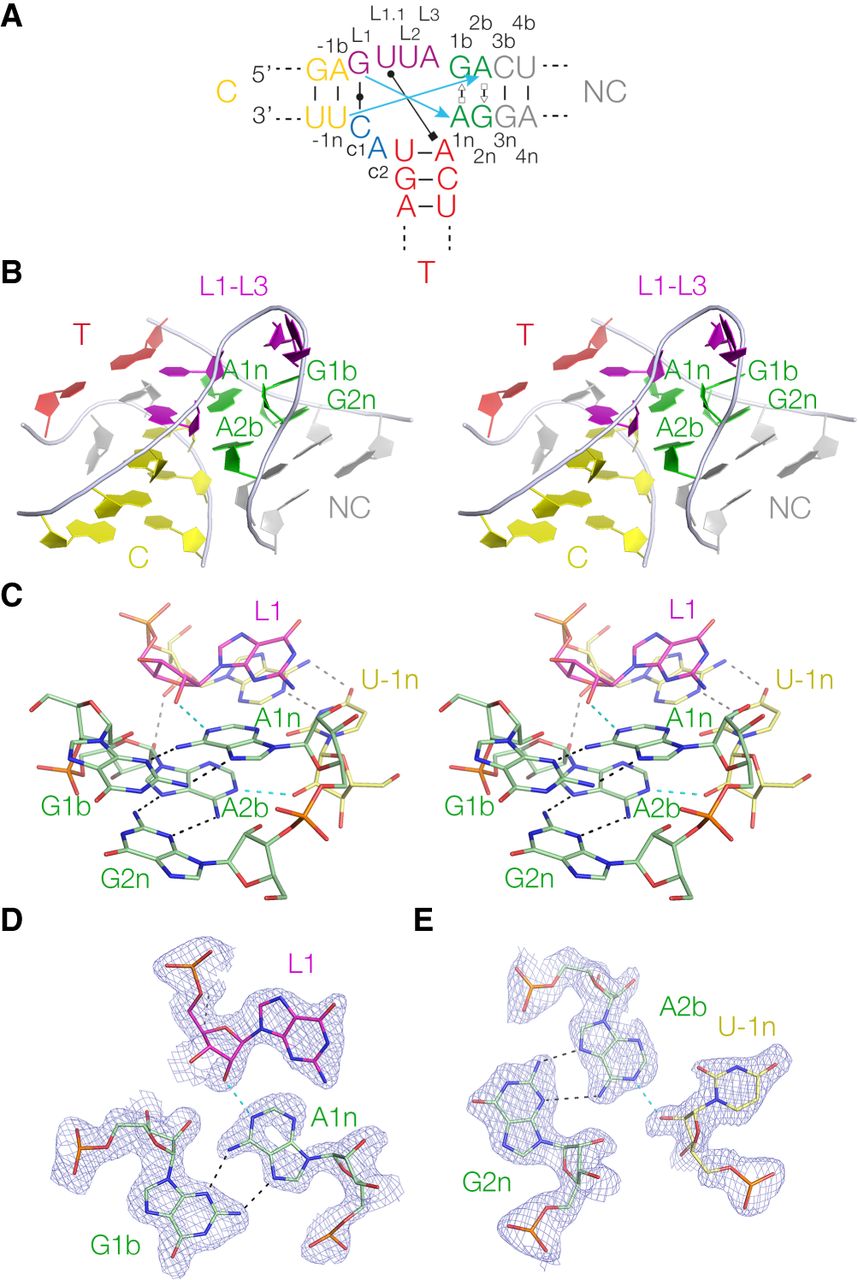
Crystal structure of the DUF-3268 k-junction. (A) Schematic of the DUF-3268 k-junction with long-range hydrogen bonds indicated. The blue arrows show the two cross-strand hydrogen bonds from L1 O2′ to A1n N1 and L-1n to A2b N1. Also shown is the cis Watson–Crick c1:GL1, and the base pair between L1.1 and the A of the first base pair of the T-helix, so forming a triple base interaction. (B) Parallel-eye stereoscopic view of the k-junction. This is viewed down onto the minor groove of the L1–L3 loop. In this view, the T-helix lies at the back. (C) Parallel-eye stereoscopic view of the core of the k-junction. The two sheared G:A base pairs are clearly visible, and the cross-strand L1 O2′ to A1n N1 and L-1n to A2b N1 hydrogen bonds are highlighted in cyan. (D) The G1b:A1n cis sugar:Hoogsteen base pair with the L1 O2′ to A1n N1 hydrogen bond (cyan). The Fo–Fc electron-density map is show contoured at 1σ. (E) The G2n:A2b cis sugar:Hoogsteen base pair with the U-1n O2′ to A2b N1 hydrogen bond (cyan). The Fo–Fc electron-density map is shown contoured at 1σ.




