


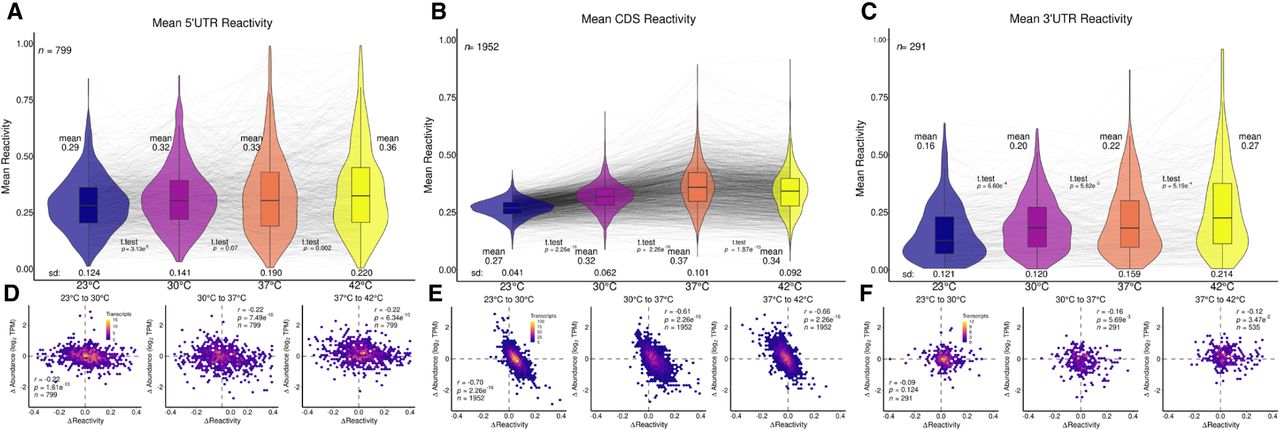
FIGURE 3.
Subregions of the transcriptome show changes in reactivity across four temperatures. Violin plots overlayed with box plots (A–C) and scatter plots (D–F) are formatted as in Figure 2. Mean reactivity across four temperatures for (A) 5′ UTR, (B) CDS, and (C) 3′ UTR. Global trends in mean reactivity exhibited by the entire transcriptome (Fig. 2) are similar to those displayed in the CDS plot (B). (D–F) Scatter plots showing Δ reactivity against Δ abundance of 23°C–30°C (left), 30°C–37°C (middle), and 37°C–42°C (right) for (D) 5′ UTR, (E) CDS, and (F) 3′ UTR. Trends exhibited by the entire transcriptome are likewise displayed in the CDS plots (E).




