


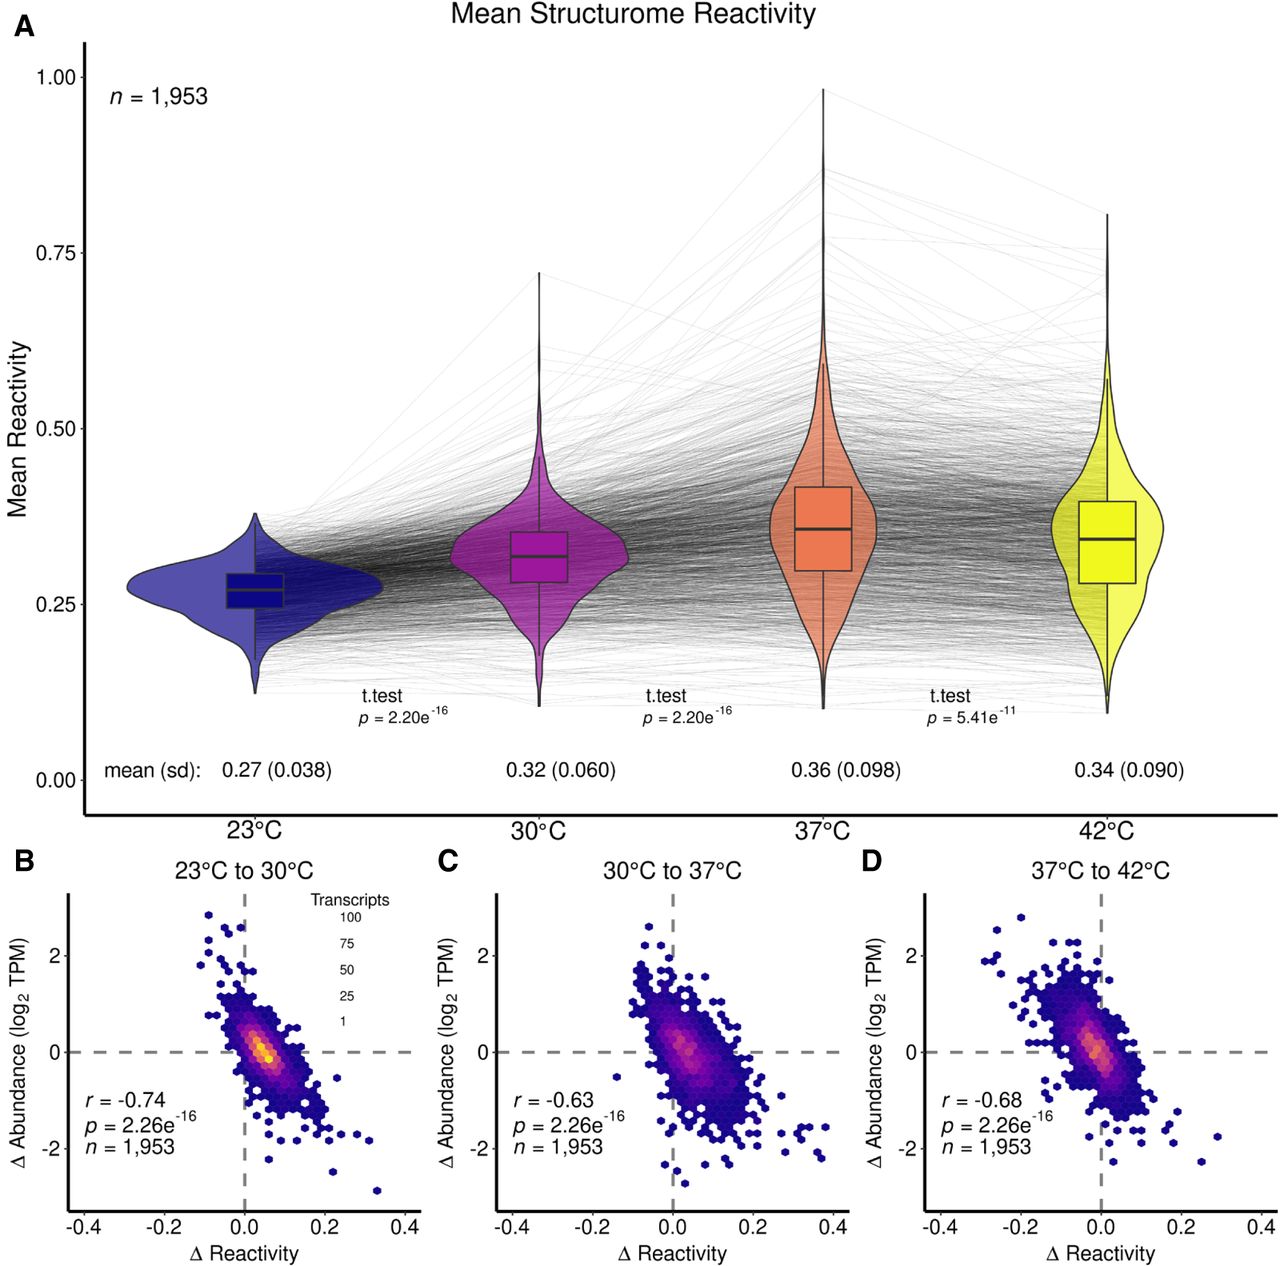
Transcriptome-wide changes in reactivity across four growth temperatures in B. subtilis. (A) Mean structurome changes in reactivity for all transcripts at 23°C (blue), 30°C (purple), 37°C (orange), and 42°C (yellow) shown as violin plots with box plots in the center. Gray spider lines link individual transcript reactivity in each condition. Global mean values are given below the violin plot for each temperature, as well as standard deviation (sd) values. Additionally, t-test P-values are given between the compared data sets. Mean reactivity increased from 23°C to 30°C, and further increased at 37°C, then slightly decreased at 42°C. (B–D) Scatter plots showing Δ reactivity (from higher temperature to lower temperature) against Δ abundance (from higher temperature to lower temperature) for (B) 23°C–30°C, (C) 30°C–37°C, and (D) 37°C–42°C. All plots show an inverse correlation with the strongest correlation shown in (B).




