


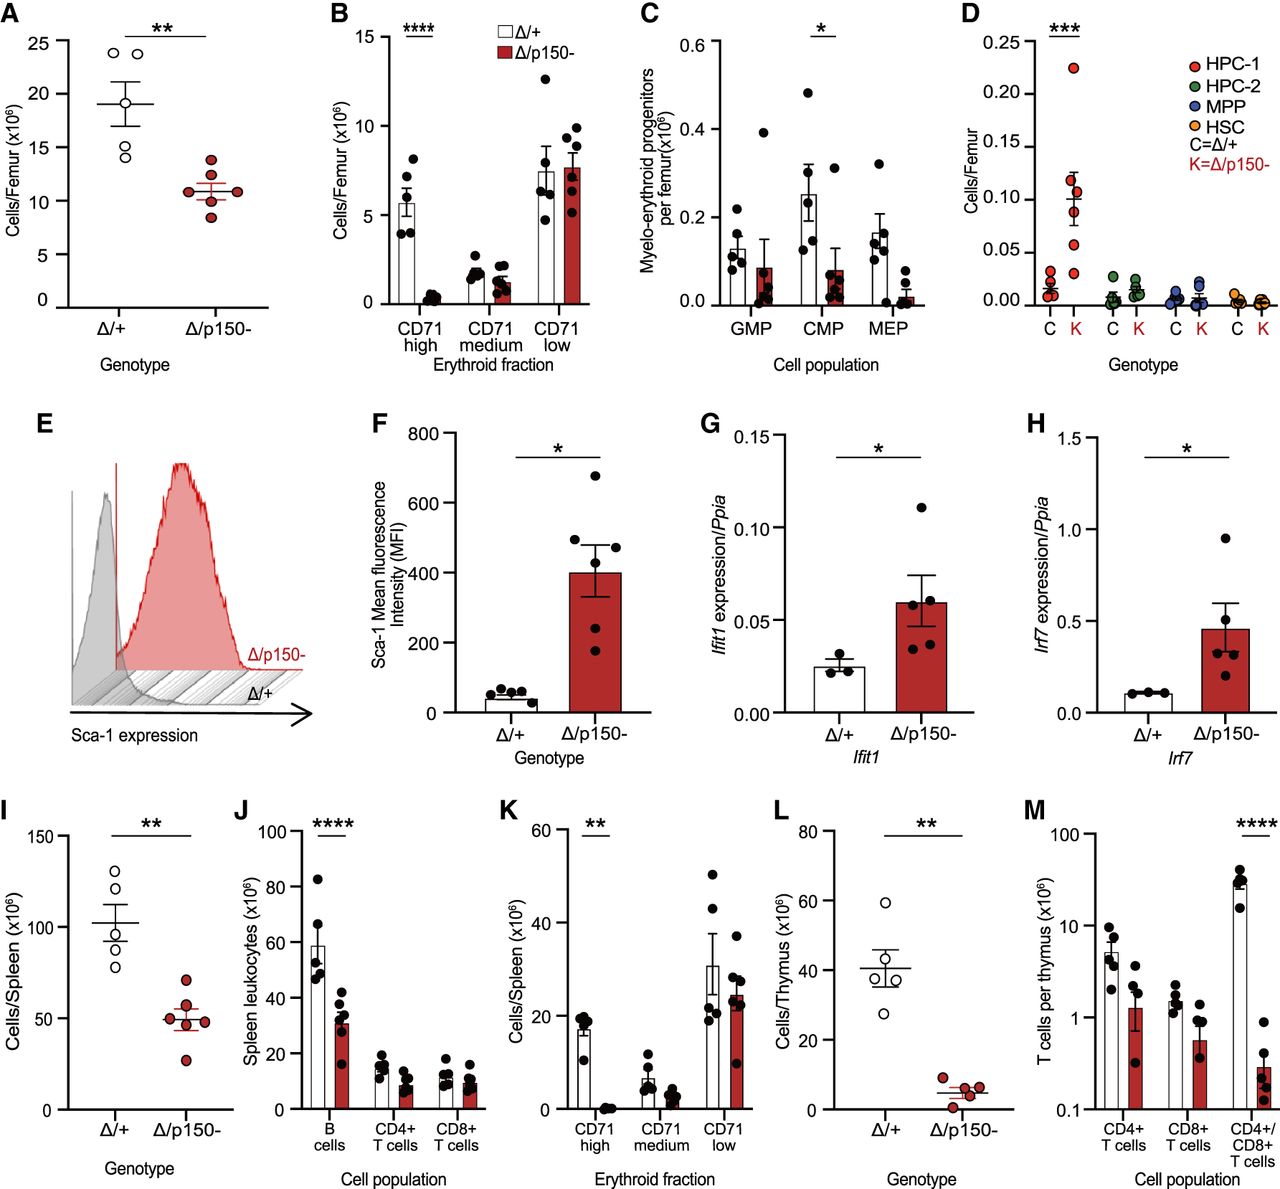
Acute loss of ADAR1p150 disrupted hematopoietic homeostasis in adult mice accompanied by an elevated innate immune response. Analysis of BM, spleen and thymus from R26-CreER Adar1Δ/+ and R26-CreER Adar1Δ/p150− animals described in Figure 3. (A) Total cellularity per femur. (B) Erythroid cells per femur. (C) Numbers of myelo-erythroid progenitors per femur. Cell populations measured were granulocyte–monocyte progenitor (GMP), common myeloid progenitor (CMP), and megakaryocyte–erythrocyte progenitor (MEP) cells. (D) The absolute number of stem cell and multipotent progenitor (MPP) populations per femur. Cell populations measured were hematopoietic progenitor cells (HPC) fractions 1 and 2, MPP, and hematopoietic stem cells (HSCs). (E) Representative flow cytometry histograms of Sca-1 expression on the lineage negative (lin−c-kit+) BM fraction. (F) Quantification of the mean Sca-1 fluorescence intensity by flow cytometry. (G) Normalized expression of Ifit1 transcripts measured by qRT-PCR in the BM; Δ/+ (n = 3) and Δ/p150− (n = 5). Data expressed as mean ± SEM gene expression relative to Ppia expression. (H) Normalized expression of Irf7 transcripts measured by qRT-PCR in the BM; Δ/+ (n = 3) and Δ/p150− (n = 5). Data expressed as mean ± SEM gene expression relative to Ppia expression. (I) Total viable cellularity of the spleen. (J) The absolute number of B lymphocytes, CD4 positive (CD4+), and CD8 positive (CD8+) T lymphocytes in the spleen. (K) Erythroid cells in the spleen. (L) Total viable cellularity of the thymus. (M) The absolute number of CD4 positive (CD4+), CD8 positive (CD8+), and CD4 and CD8 double positive (CD4+/CD8+) T cells in the thymus. Statistical tests used were unpaired t-test (A,F,G,H,I,L) and two-way ANOVA (B,C,D,J,K,M) with Bonferroni's multiple comparisons with statistical significance of (*) P < 0.05, (**) P < 0.01, (***) P < 0.001, and (****) P < 0.0001. Data expressed as mean ± SEM. In (A–F) and (I–M), Δ/+ (n = 5) and Δ/p150 − (n = 6).




