


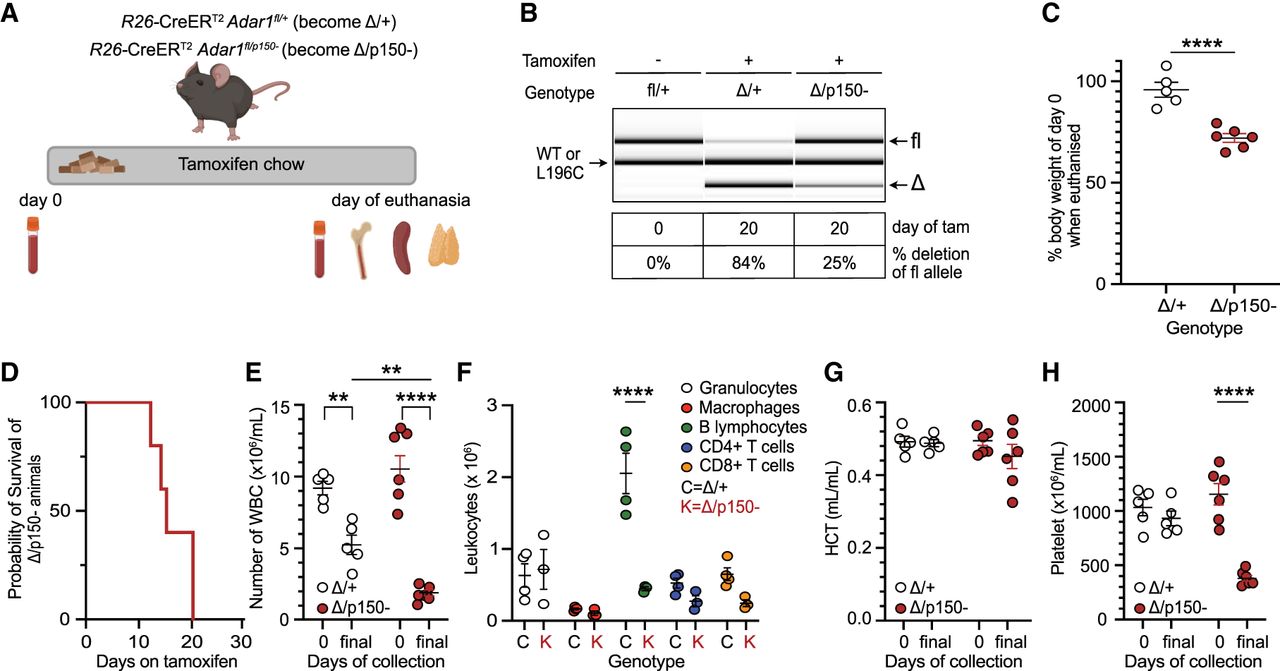
Somatic deletion of ADAR1p150 in adult mice is lethal. (A) Illustration of somatic deletion model. Upon tamoxifen treatment, R26-CreER Adar1fl/+ and R26-CreER Adar1fl/p150− animals became Δ/+ and Δ/p150−, respectively. (B) Representative genotyping of genomic DNA and percentage deletion of the floxed allele on the day of euthanasia using DNA isolated from whole BM. Image and recombination percentages were calculated using LabChip (PerkinElmer). (C) Percentage change in body weight on the day of euthanasia compared to day 0 (before the start of the tamoxifen diet). Δ/+ (n = 5) and Δ/p150− (n = 6). (D) Kaplan–Meier survival plot of the Δ/p150− animals (n = 6). Note the control animals are not plotted and were healthy; each Δ/p150− was collected with a control animal on the same day to allow paired analysis. (E) Total white blood cell counts (WBC) in peripheral blood (PB) at day 0 (pre-tamoxifen) and day of euthanasia (final). (F) Absolute numbers of each lineage in PB on the day of euthanasia (final). (G) Hematocrit (HCT) populations in PB at day 0 (pre-tamoxifen) and day of euthanasia (final). (H) Total platelets in the PB at day 0 (pre-tamoxifen) and day of euthanasia (final). Statistical comparison in all plots was done by unpaired t-test (C), two-way ANOVA (E,G,H) with Bonferroni's multiple comparisons or ordinary two-way ANOVA (F) tests with statistical significance of (*) P < 0.05, (**) P < 0.01, (***) P < 0.001, and (****) P < 0.0001. Data represented as mean ± SEM.




