


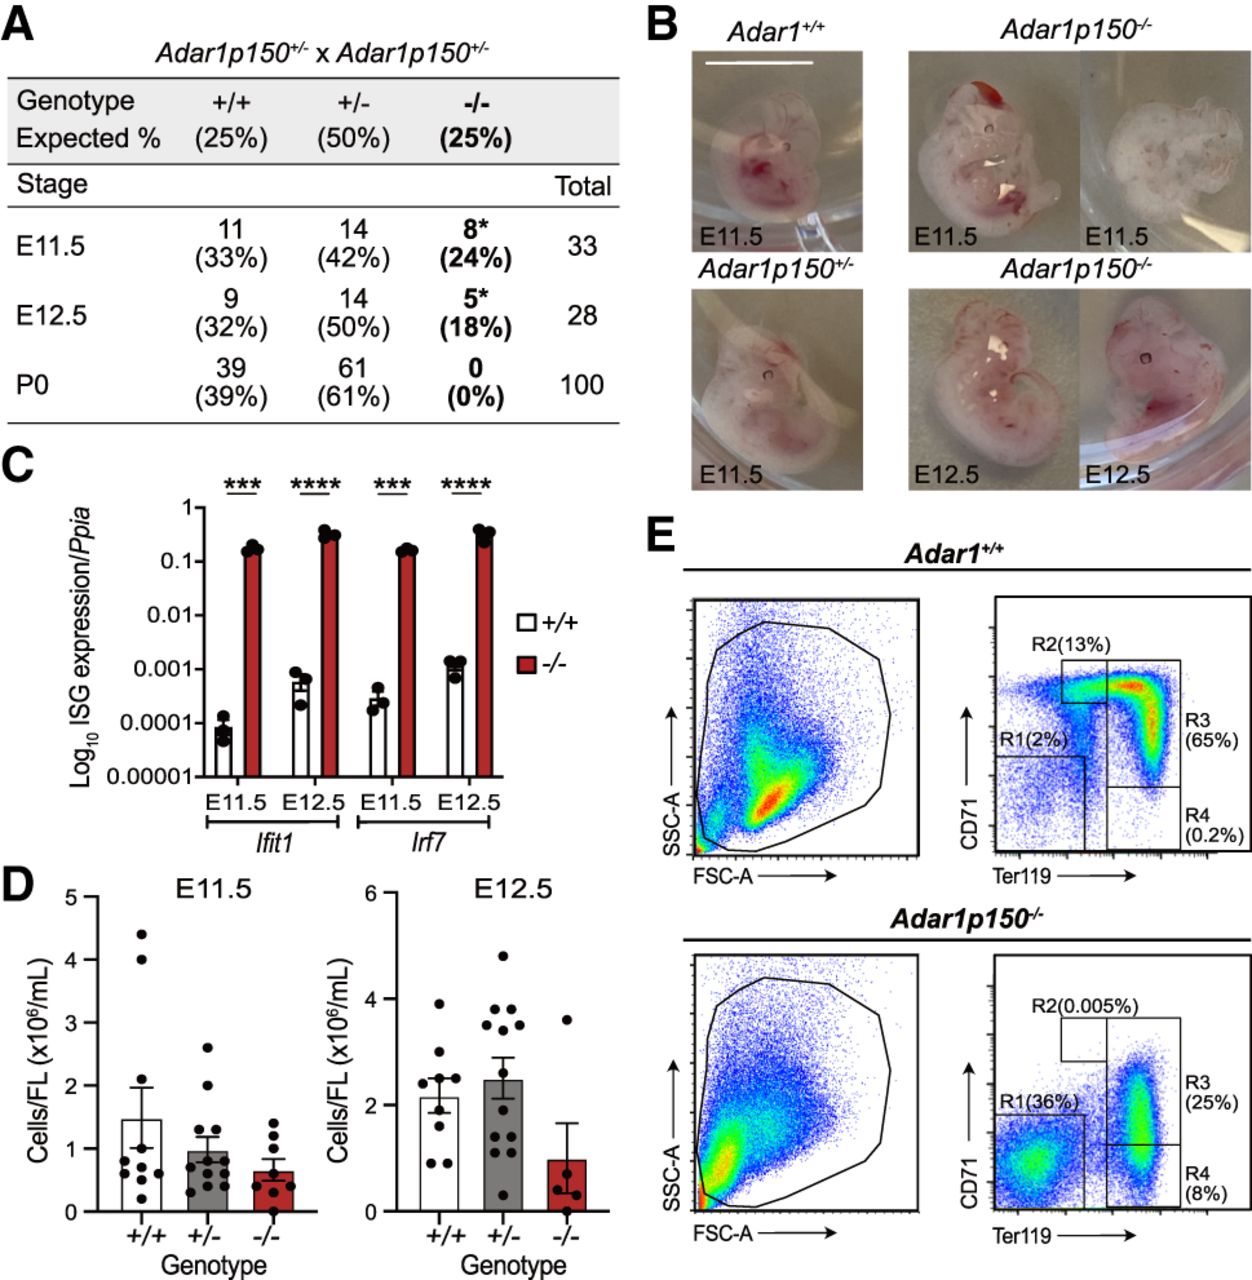
ADAR1p150-specific knockout mice die mid-gestation at E11.5–E12.5. (A) Survival and frequency of Adar1+/+, Adar1p150+/−, and Adar1p150−/− mice at three development stages E11.5, E12.5, and P0 (day of birth) from Adar1p150+/− inter-crosses. (B) Representative images of embryos of the indicated genotypes at E11.5 or E12.5. The scale bar represents 0.5 cm. (C) Expression of Ifit1 and Irf7, both ISGs, in Adar1+/+ and Adar1p150−/− embryos’ at E11.5 and E12.5. Data expressed as log10 gene expression relative to Ppia expression (reference gene). Three independent samples were used for each indicated genotype and developmental stage. Significance was determined by a two-way ANOVA test with Bonferroni's multiple comparisons with statistical significance of (***) P < 0.001 and (****) P < 0.0001. Data represent the mean ± SEM. (D) Cellularity of FL from E11.5 (left) and E12.5 (right). At E11.5, the number of Adar1+/+ (+/+) n = 10, Adar1p150+/− (+/−) n = 12, and Adar1p150−/− (−/−) n = 8. At E12.5, the number of +/+ n = 9, +/− n = 13, and −/− n = 5. Significance was determined by a one-way ANOVA test with Dunnett's multiple comparisons. Error bars are SEM. (E) Representative flow cytometry profiles of FL erythroid cells of interest at E12.5 with SSC-A/FSC-A (left); the proportion of erythroblast population of the viable FL erythroid cells labeled with CD71/Ter119 (right). R1 = CD71−Ter119−, R2 = CD71highTer119med, R3 = CD71highTer119high, and R4 = CD71−Ter119high.




