


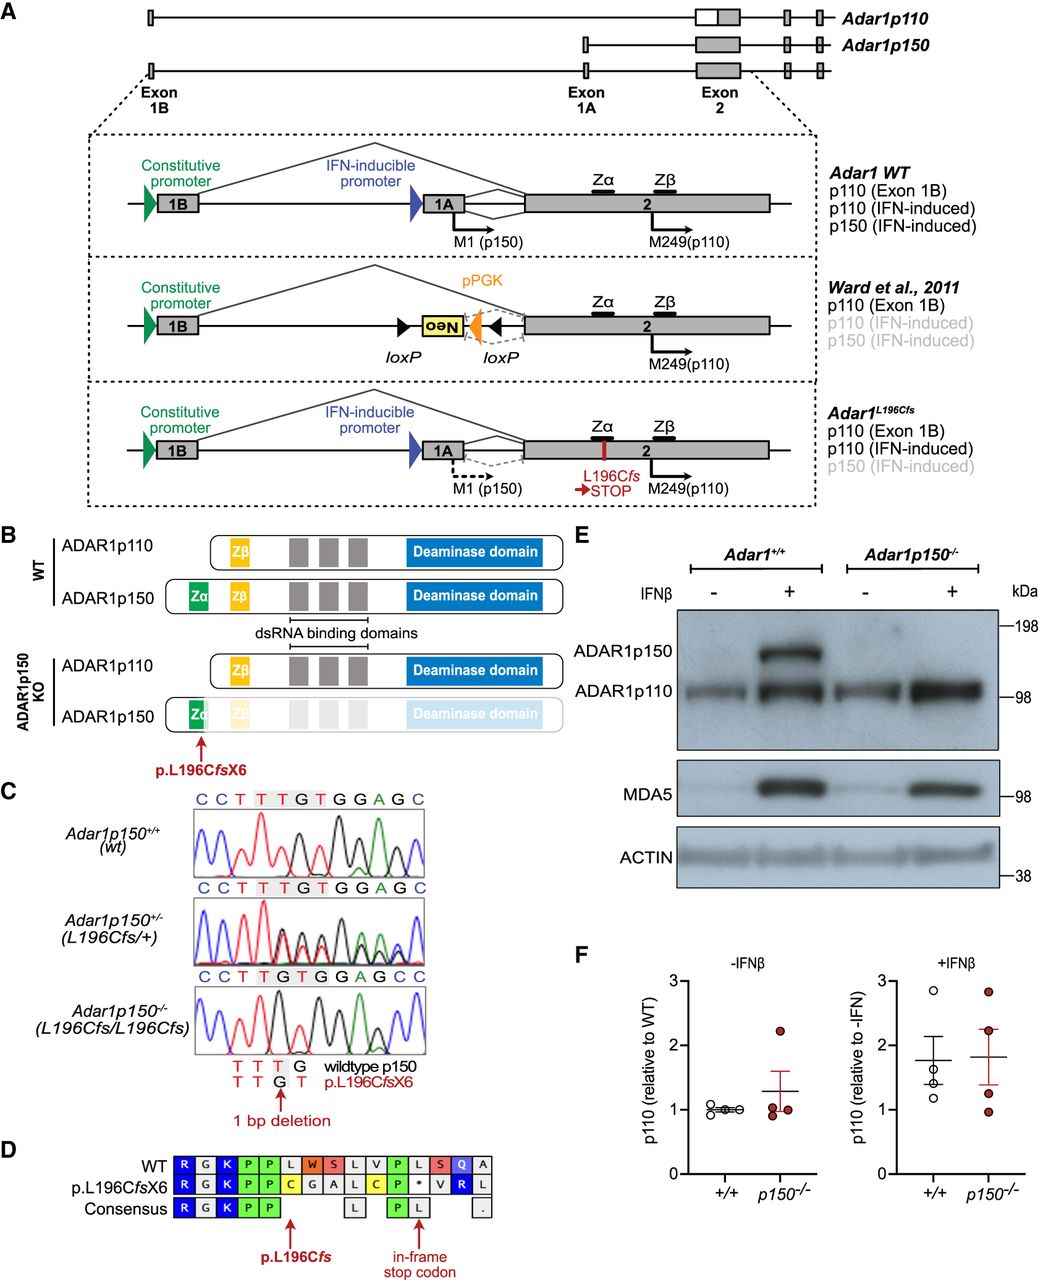
Adar1L196Cfs mutation leads to an isoform-specific deletion of ADAR1p150 but retention of p110. (A) Genomic organization of the murine Adar locus showing locations of alternative exon 1A/1B and exon 2 and individual promoters and initiation (M1 and M249) codons that lead to expression of two ADAR1 isoforms. The IFN-inducible promoter upstream of exon 1A leads to the ADAR1p150 expression from M1, and ADAR1p110 from M249 when leaky ribosome scanning occurs. The constitutive promoter upstream of exon 1B maintains the constitutive expression of ADAR1p110. The schematic provides the comparison of the locus and protein products from wild-type (WT) Adar, the previous ADAR1p150-deficient model (Ward et al. 2011c) and the L196Cfs allele described in this report. (B) Schematic of the WT ADAR1 isoforms p110 and p150 and the location of the L196Cfs mutation that leads to knockout of the ADAR1p150 protein. (C) Sanger sequencing chromatogram and alignments of genomic DNA isolated from Adar1+/+, Adar1p150+/− (Adar1L196Cfs/+), and Adar1p150−/− (Adar1L196Cfs/L196Cfs) animals indicating 1 bp deletion in the L196Cfs mutation. (D) Predicted amino acid translation of the WT ADAR1p150 and L196Cfs allele. (E) Western blot analysis of WT Adar1+/+ and Adar1p150−/− mouse embryonic fibroblasts (MEFs) after 24 h of IFN-beta (IFNβ) treatment. Expression of ADAR1 isoforms p150 and p110, MDA5 as well as ACTIN are indicated. (F) Quantification of the western blots is shown in (E) and Supplemental Figure S1C. ADAR1p110 expression was normalized to ACTIN. The left panel shows ADAR1p110 expression at baseline normalized to Adar1+/+. The right panel shows ADAR1p110 levels plus IFN normalized to minus IFN for each cell line. N = 4 for both Adar1+/+ (+/+) and Adar1p150−/− (p150−/−) generated from three independent mice. The figure presented here is the replicate of the samples in lanes 3–6 of Supplemental Figure S1C (left image) from a different batch of IFNβ treatment. Data represent the mean ± SEM.




