


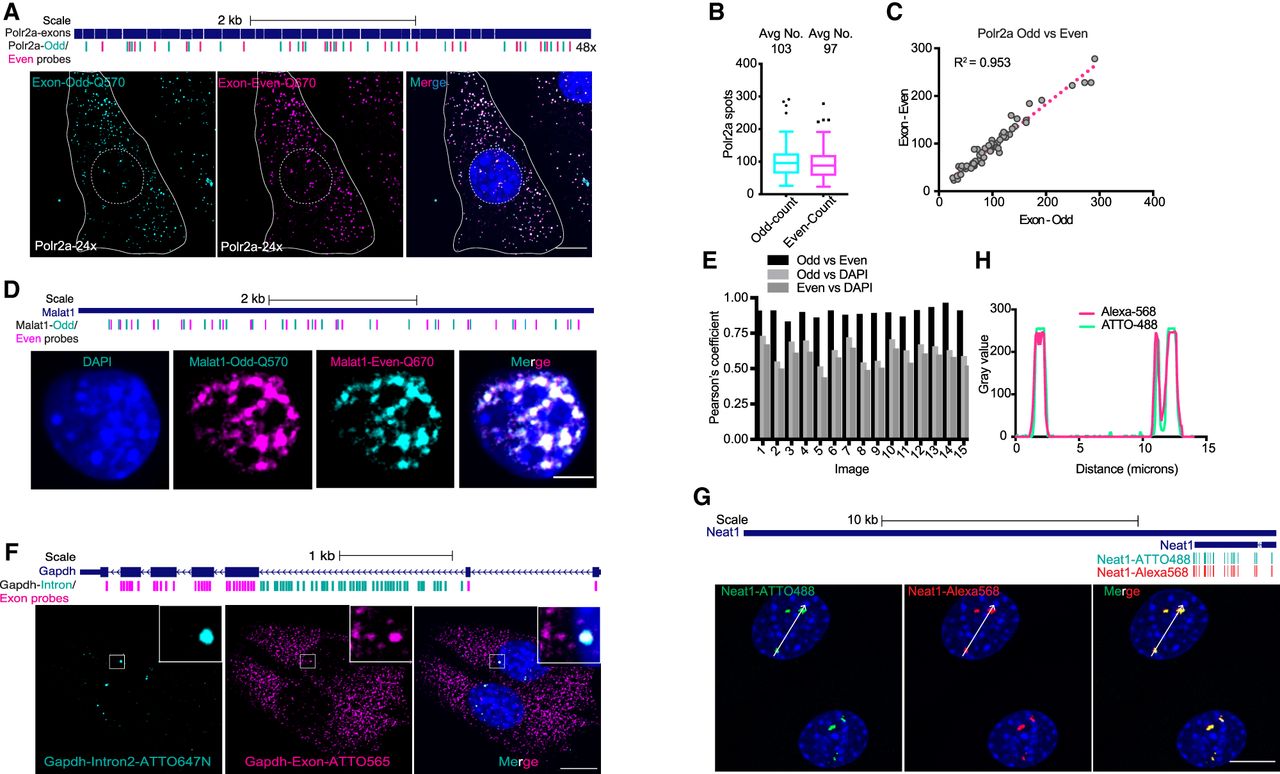
Performance of fluorescently labeled probes in FISH assays. (A, top) Diagram showing the locations of odd and even probes across the Polr2a coding regions (exons) in the mouse genome. (Bottom) Confocal microscopy images of C2C12 cells probed with the Polr2a odd and even FISH probes. The nuclear outline is indicated by a dashed line, and the cell boundary by a solid white line. (B) Box plots of the spot counts in C2C12 cells for Polr2a in the odd and even channels using FISH-quant software. The average number of spots per cell for the Polr2a odd and even signals is shown above. (C) The correlation of the odd and even spot numbers per cell are displayed in a scatter plot with the R2 indicated. Fifty-nine cells were counted and plotted. (D, top) Diagram of the locations of the odd and even probes for Malat1. (Bottom) Confocal microscopy images of C2C12 cells probed with the Malat1-odd and -even probes. (E) Bar graph of Pearson's coefficients determined for each of 15 images. Pairwise correlations of the per pixel fluorescence intensity in two channels: Quasar570 (Malat1-odd) versus Quasar670 (Malat1-even), Quasar570 (Malat1-odd) versus DAPI, and Quasar670 (Malat1-even) versus DAPI. (F, top) Diagram of the locations of Exon (magenta) and Intron (cyan) probes for Gapdh arrayed along the annotated mouse gene. (Bottom) Confocal microscopy images of C2C12 cells hybridized with the Gapdh exon and intron probes. The white boxed area is enlarged at the top right corner. (G, top): Diagrams of the ATTO488 (green) and Alexa568 (red) probe locations arrayed along the Neat1 short isoform in the mouse gene annotation. (Bottom) Confocal microscopy images of C2C12 cells hybridized with 25 Neat1 ATTO488 probes (green), and 25 Neat1 Alexa568 probes (red), with DAPI in blue. (H) Line scan profile of the ATTO488 (green) and Alexa568 (red) intensities for the cell shown in G. Scale bar, 10 μm.




