


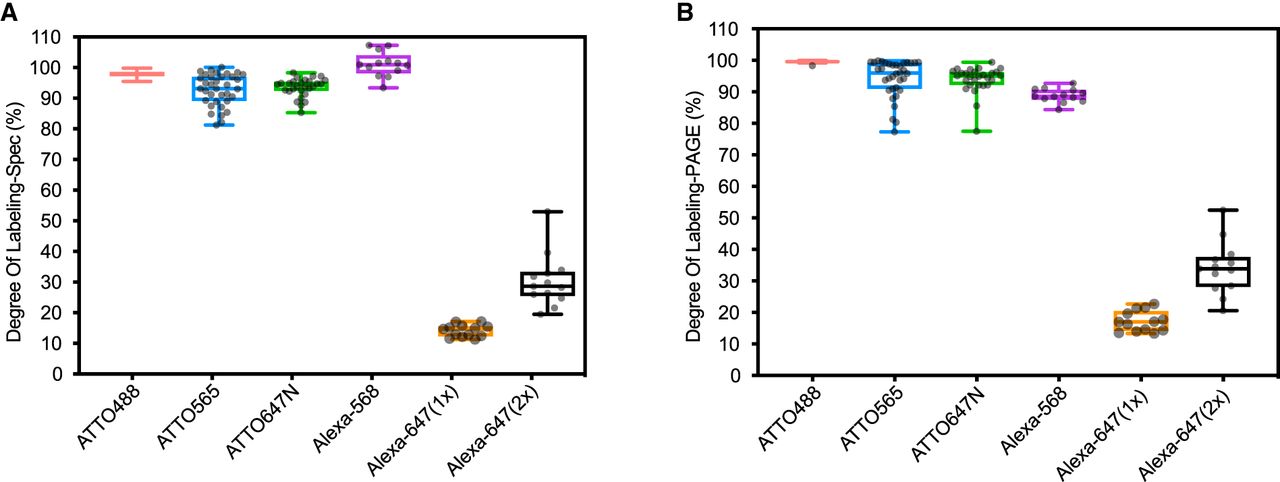
Labeling efficiency for spectrally distinct dyes. (A) Box plots showing the DOL of multiple probe sets with multiple ATTO and Alexa dyes determined by spectrophotometer. (B) Box plots of the DOL values for ATTO and Alexa dyes determined by PAGE. Each dye was used to label multiple probe sets. Each dot represents the labeling of one probe set containing up to 48 oligos (all sequences are in Supplemental Tables S5–S9). The midline of each box represents the median DOL across all the experiments, the box edges define the interquartile range and the whiskers the maximum and minimum DOL values. DOL values were determined as described in the Materials and Methods and Supplemental Figure S2.




