


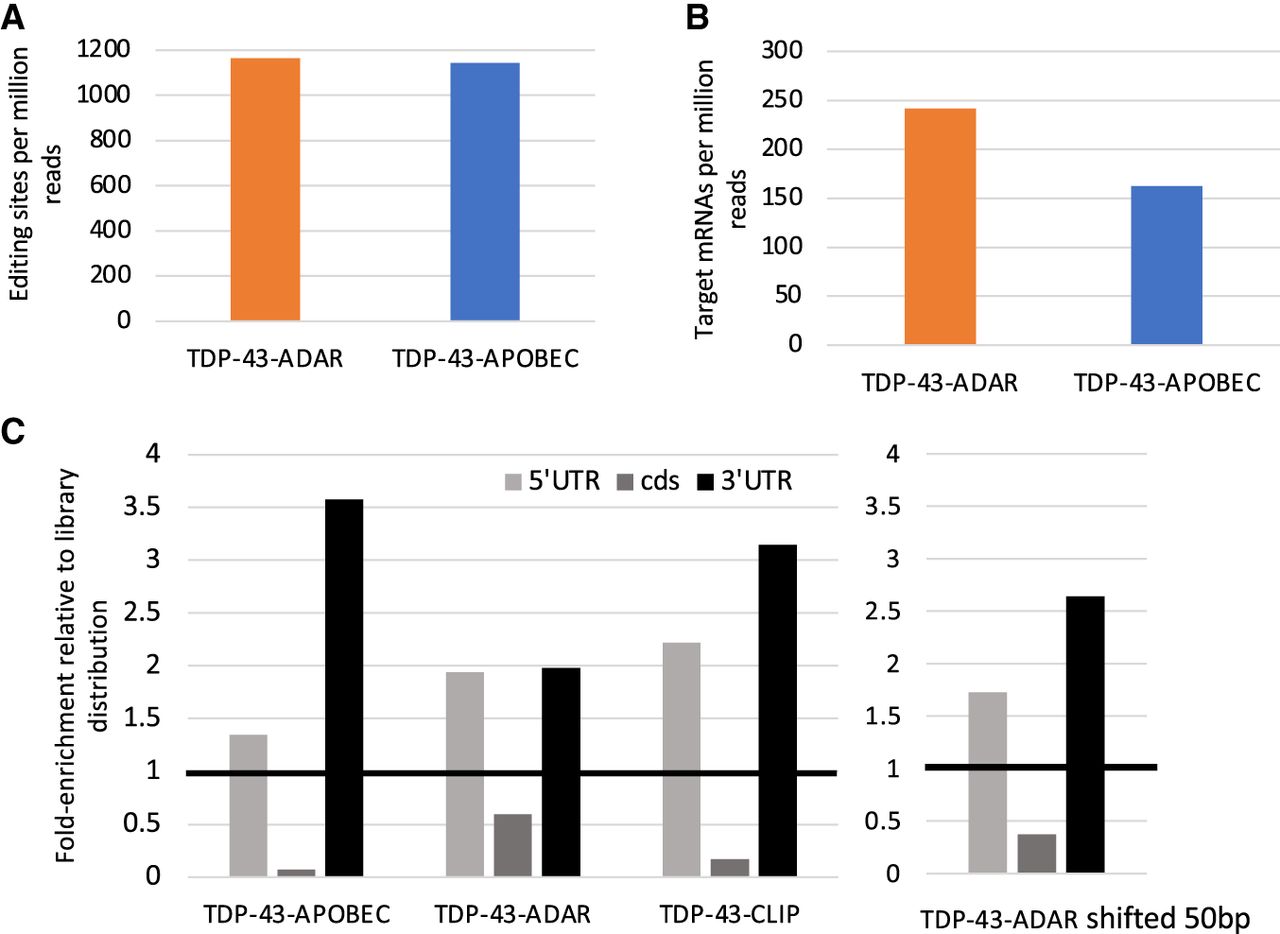
TDP-43-ADAR and TDP-43-APOBEC generated similar numbers of editing sites that were preferentially located in the 3′-UTR and 5′-UTR. (A) Quantification of the number of editing sites generated by TDP-43-ADAR and TDP-43-APOBEC (A to G changes are indicated for ADAR and C to T changes for APOBEC). This graph shows only editing sites that were consistent between two biological replicates not found in enzyme-only controls. The number of editing sites identified was normalized per million reads to adjust for sequencing library depth. (B) The number of target transcripts identified by TDP-43-ADAR and TDP-43-APOBEC. (C) The distribution of editing sites in the 5′-UTR, coding sequence (cds), and 3′-UTR was calculated for TDP-43-ADAR and TDP-43-APOBEC as well as TDP-43-CLIP. The graphs show the fold enrichment relative to the read distribution of the RNA sequencing library. In all cases, the 3′-UTR and 5′-UTR enrichment is significant using a proportion test; P-value <0.0001. CLIP data is from Hallegger et al. (2021). (Right) TDP-43-ADAR editing sites were shifted by 50 bp toward the end of the transcripts and the localization of the sites was reexamined. There was a 16% increase in the number of sites in the 3′-UTR.




