


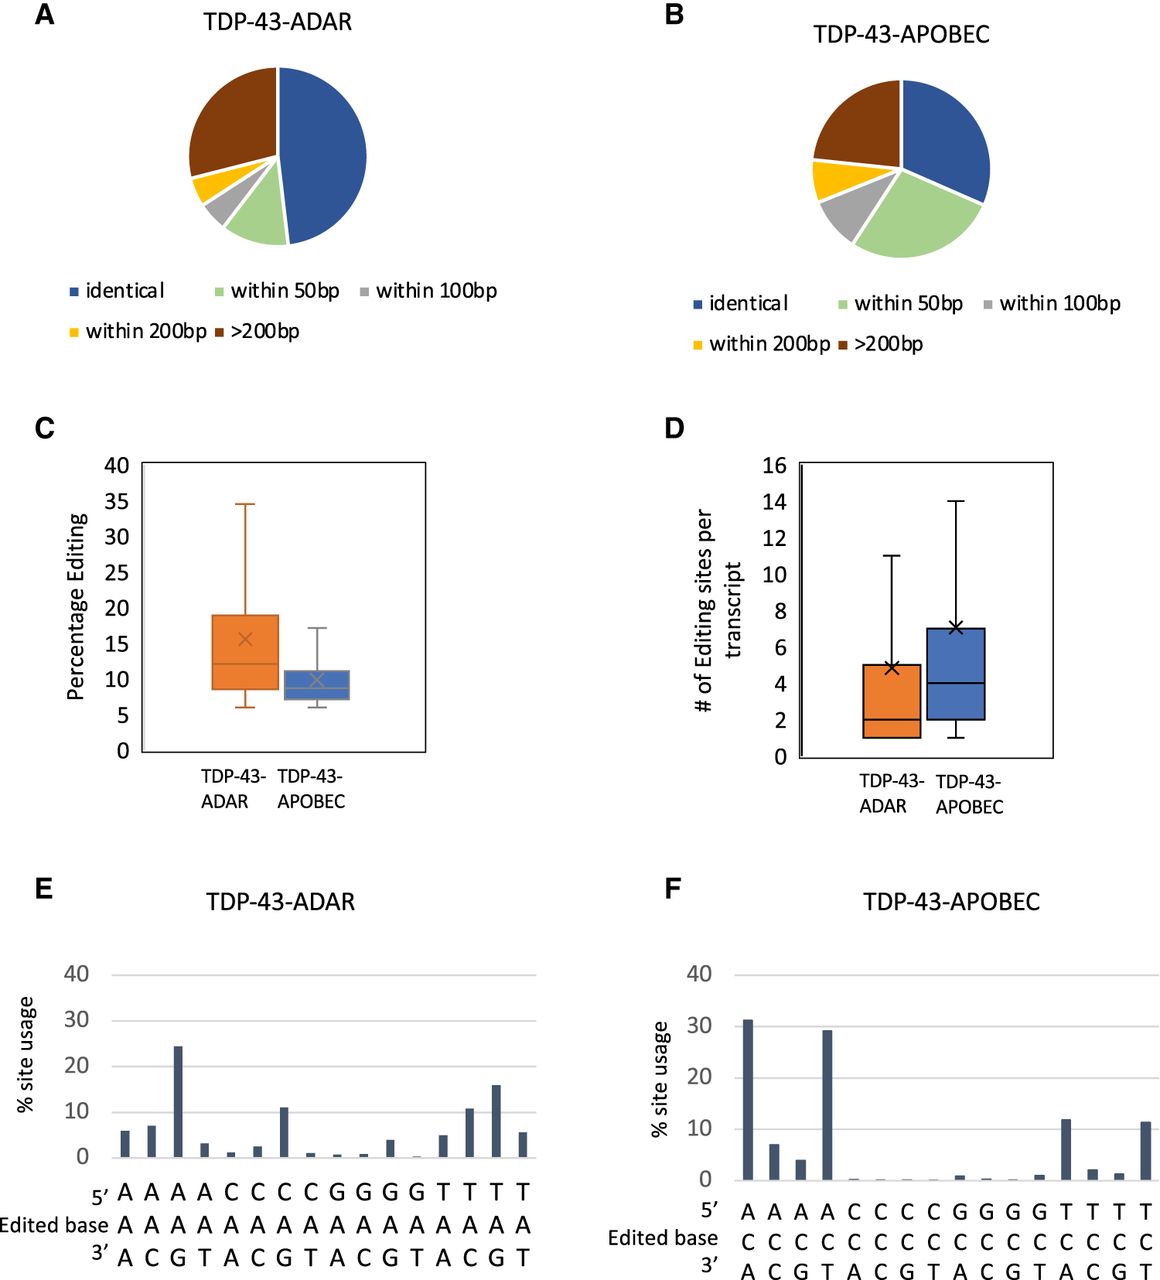
TDP-43 TRIBE and TDP-43 STAMP identify editing sites with different characteristics on TDP-43 target transcripts. (A,B) Pie charts showing the relationship between editing sites in two biological replicates. Editing sites identified in both experiments at: identical locations (dark blue), two different locations that are in close proximity in the biological replicates (green and gray; 50–100 bp), within 200 bp (yellow), or >200 bp (dark red). (C) Mean percentage editing for all editing sites identified in TDP-43-ADAR (∼15%) and TDP-43-APOBEC (∼10%). Mean values indicated by X and median values by lines (P-value <0.0001; Wilcoxon rank-sum test). (D) Mean editing sites per transcript generated by TDP-43-APOBEC (∼7) and TDP-43-ADAR (∼5) (mean indicated by X and median indicated by a line; P-value <0.0001; Wilcoxon rank-sum test). (E,F) The near neighbors of all edited nucleotides were identified and quantified (percentage of all editing sites). TDP-43-ADAR (E) preferentially edited adenosines followed by guanosine. TDP-43-APOBEC (F) preferentially edited cytosines that were flanked by A or T.




