


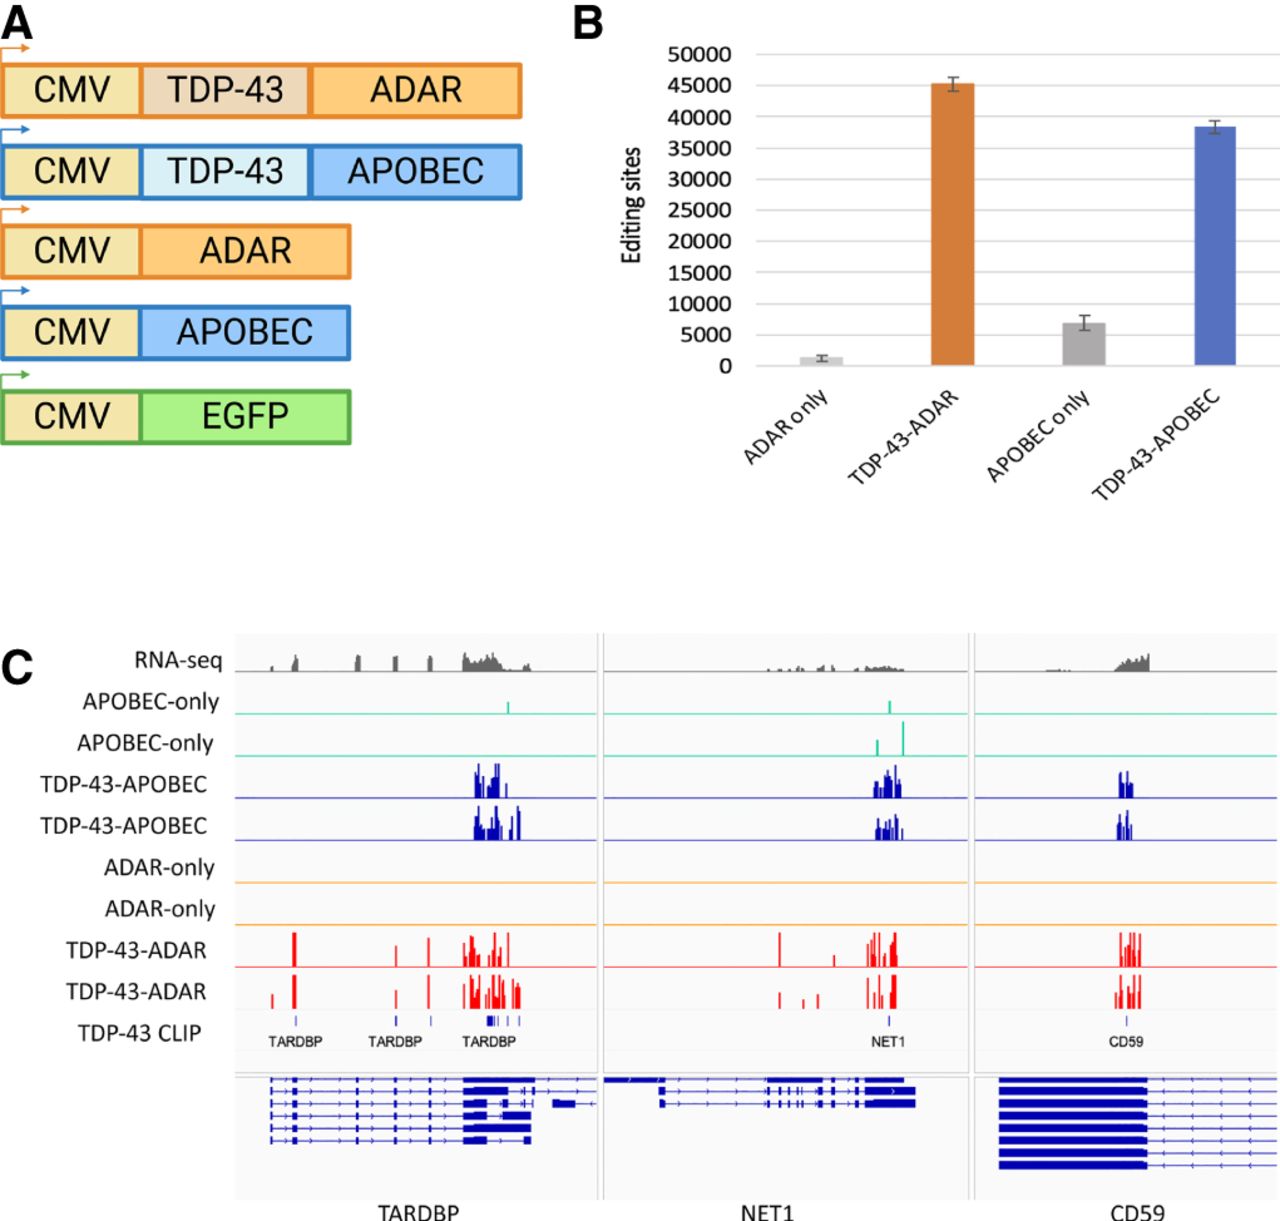
Both TDP-43 TRIBE (ADAR) and TDP-43 STAMP (APOBEC) identify candidate TDP-43 targets in HEK-293 cells. (A) Design of constructs for the expression of TDP-43-ADAR, TDP-43-APOBEC and their respective controls in HEK-293 cells. All transgenes were expressed using the cytomegalovirus (CMV) promoter. (B) The average number of editing sites identified in HEK-293 cells expressing TDP-43-ADAR, TDP-43-APOBEC, ADAR, or APOBEC alone. The graph quantifies A to G changes for ADAR and C to T changes for APOBEC. Two biological replicates are shown. Error bars indicate standard deviation. (C) Visualization of RNA editing sites generated by TDP-43-ADAR (red) and TDP-43-APOBEC (blue) on TARDBP (the gene encoding TDP-43), NET1 and CD59. The Integrated Genomics Viewer (IGV; Robinson et al. 2011; Thorvaldsdottir et al. 2013) visualization of two biological replicates of TDP-43-ADAR (red), TDP-43-APOBEC (blue), ADAR alone (orange), and APOBEC alone (green). Y-axis is 20% for all editing site tracks. RNA sequencing data is shown on top in gray; y-axis is 1000 fpkm. TDP-43-CLIP sites are shown in the bottom track; each line represents a CLIP site (Hallegger et al. 2021). The direction of transcription is denoted by the arrows on the refseq genes. Exons are shown as closed blocks and introns as lines.




