


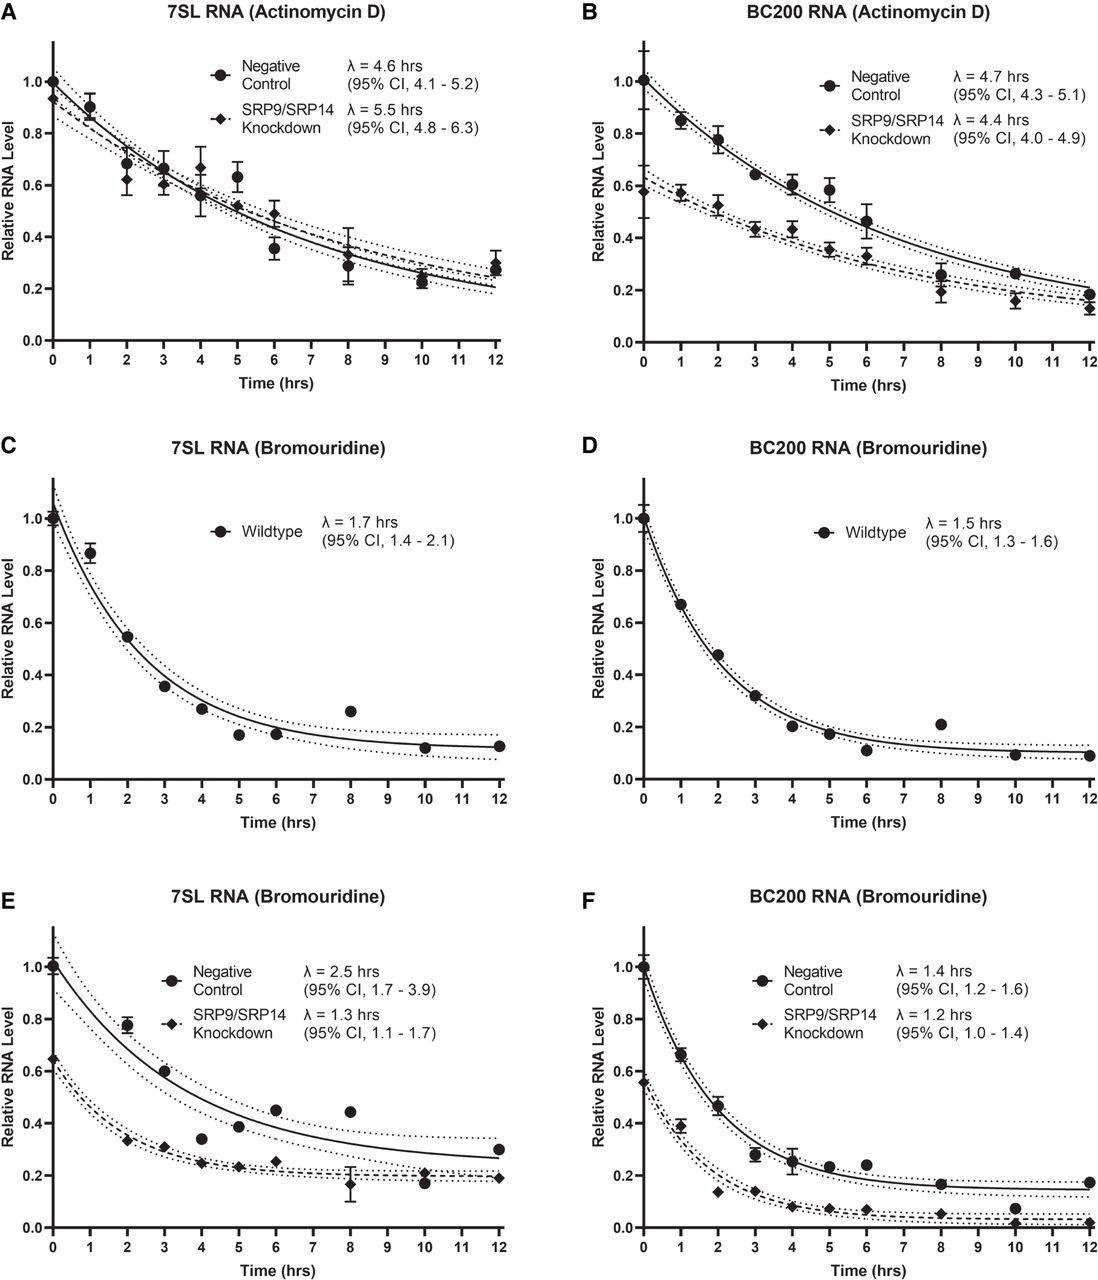
7SL and BC200 RNA half-lives are unaffected by SRP9/SRP14 knockdown. (A) MCF-7 cells were transfected with either negative control or SRP14 siRNA (SRP9/SRP14 knockdown) for 24 h prior to treatment with 5 µg/mL actinomycin D. At indicated time points, an equal number of cells were harvested and whole-cell lysate RNA extraction was performed. An equal volume of RNA was measured by RT-qPCR with primers specific to 7SL. Data represent the mean of three biological replicates measured in duplicate relative to t = 0 for the negative control, with error represented as ±SD. Half-lives were calculated by fitting the data to a one-phase decay equation with a constraint of plateau = 0.05 using GraphPad Prism 9 software. Confidence bands demonstrate the likely location of the true curve with a 95% confidence interval. Error was presented as a 95% asymmetrical (profile-likelihood) confidence interval. (B) Same as in (A) but with primers specific to BC200. (C) MCF-7 cells were grown for 24 h with 150 µM 5′-bromouridine. After 24 h, cells were provided fresh media without 5′-bromouridine and collected at the indicated time points for bromouridine immunoprecipitation chase (BRIC). An equal volume of RNA was measured by RT-qPCR with primers specific to 7SL. Data are representative of three biological replicates, presented as the mean of three technical replicates relative to t = 0, with error bars indicating ±SD. Half-lives were calculated by fitting the data to a one-phase decay equation with no constraints using GraphPad Prism 9 software. Confidence bands and error presentation as in (A). (D) Same as in (C) but with primers specific to BC200. (E) Same as in (C) but transfected with either negative control or SRP14 siRNA (SRP9/SRP14 knockdown) for 24 h prior to removal of 5′-bromouridine. Data points are relative to t = 0 for the negative control. (F) Same as in (E) but with primers specific to BC200.




