


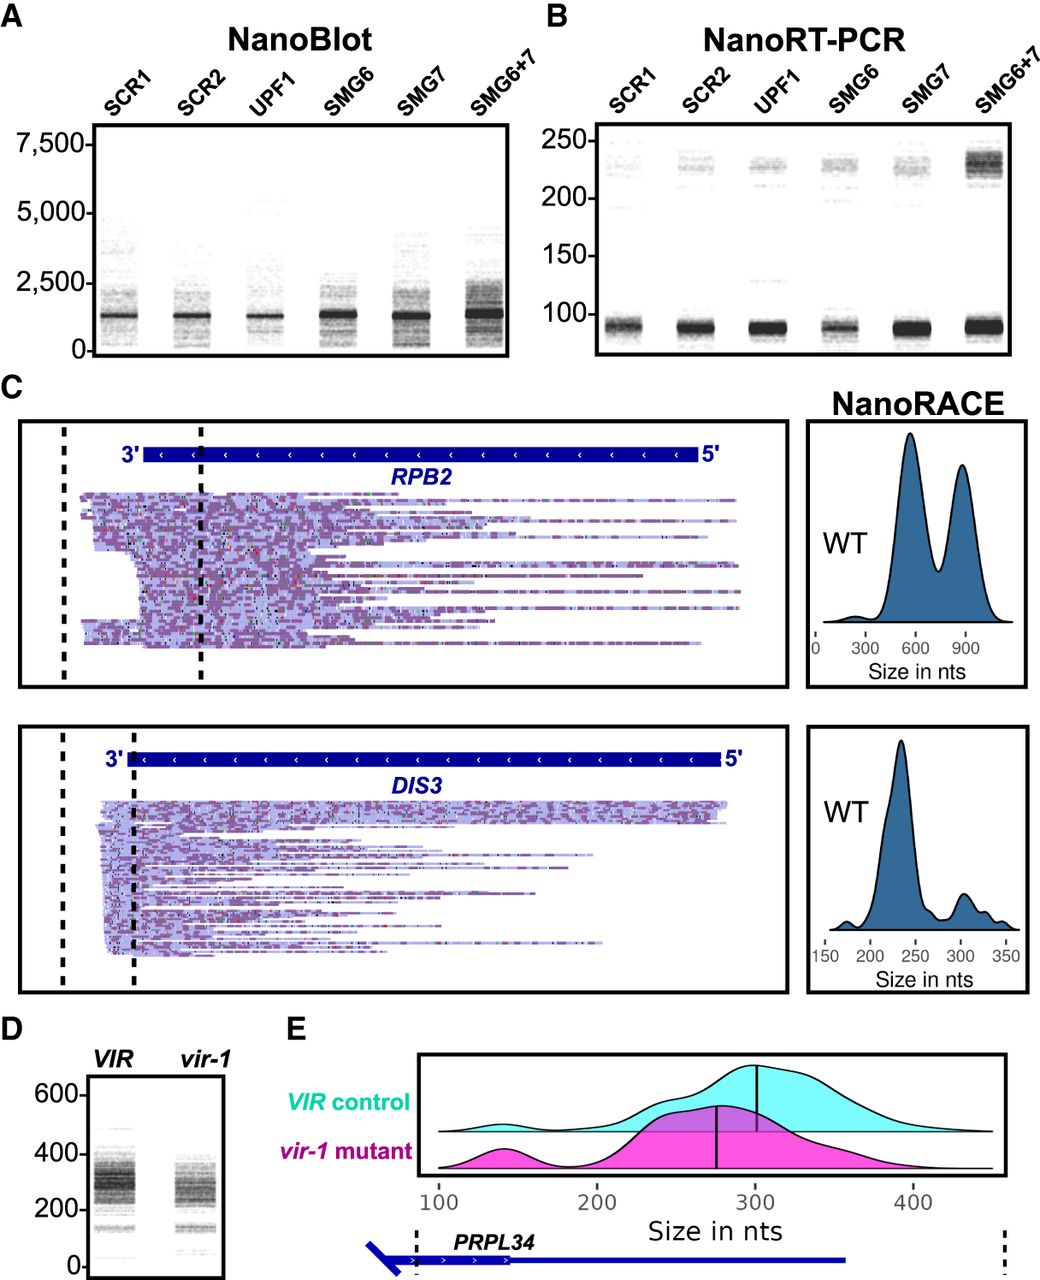
NanoRT-PCR, NanoRACE, and NanoRidge. (A) Nanoblot plot showing an alternative exon inclusion event (SCR1) Scramble 1, (SCR2) Scramble 2, (UPF1) UPF1 Knockdown, (SMG6) SMG6 Knockdown, (SMG7) SMG7 Knockdown, (SMG6 + 7) SMG6 and SMG7 Double Knockdown. (B) NanoRT-PCR plot with a viewing window spanning the alternative exon. Labels same as in A. (C) IGV screenshots of WT sequencing data and NanoRACE plots. RPB2 shows alternative polyadenylation site usage while DIS3 shows a single poly(A) site. Note the abundance of short reads making representation via a nanoblot challenging. (D) NanoRACE of reads mapping to the Arabidopsis thaliana PRPL34 gene obtained from the VIR control or vir1-1 mutant samples shown as a blot. (E) NanoRACE representation of PRPL34 data shown as a ridge plot. The vertical black lines indicate the median read length.




