


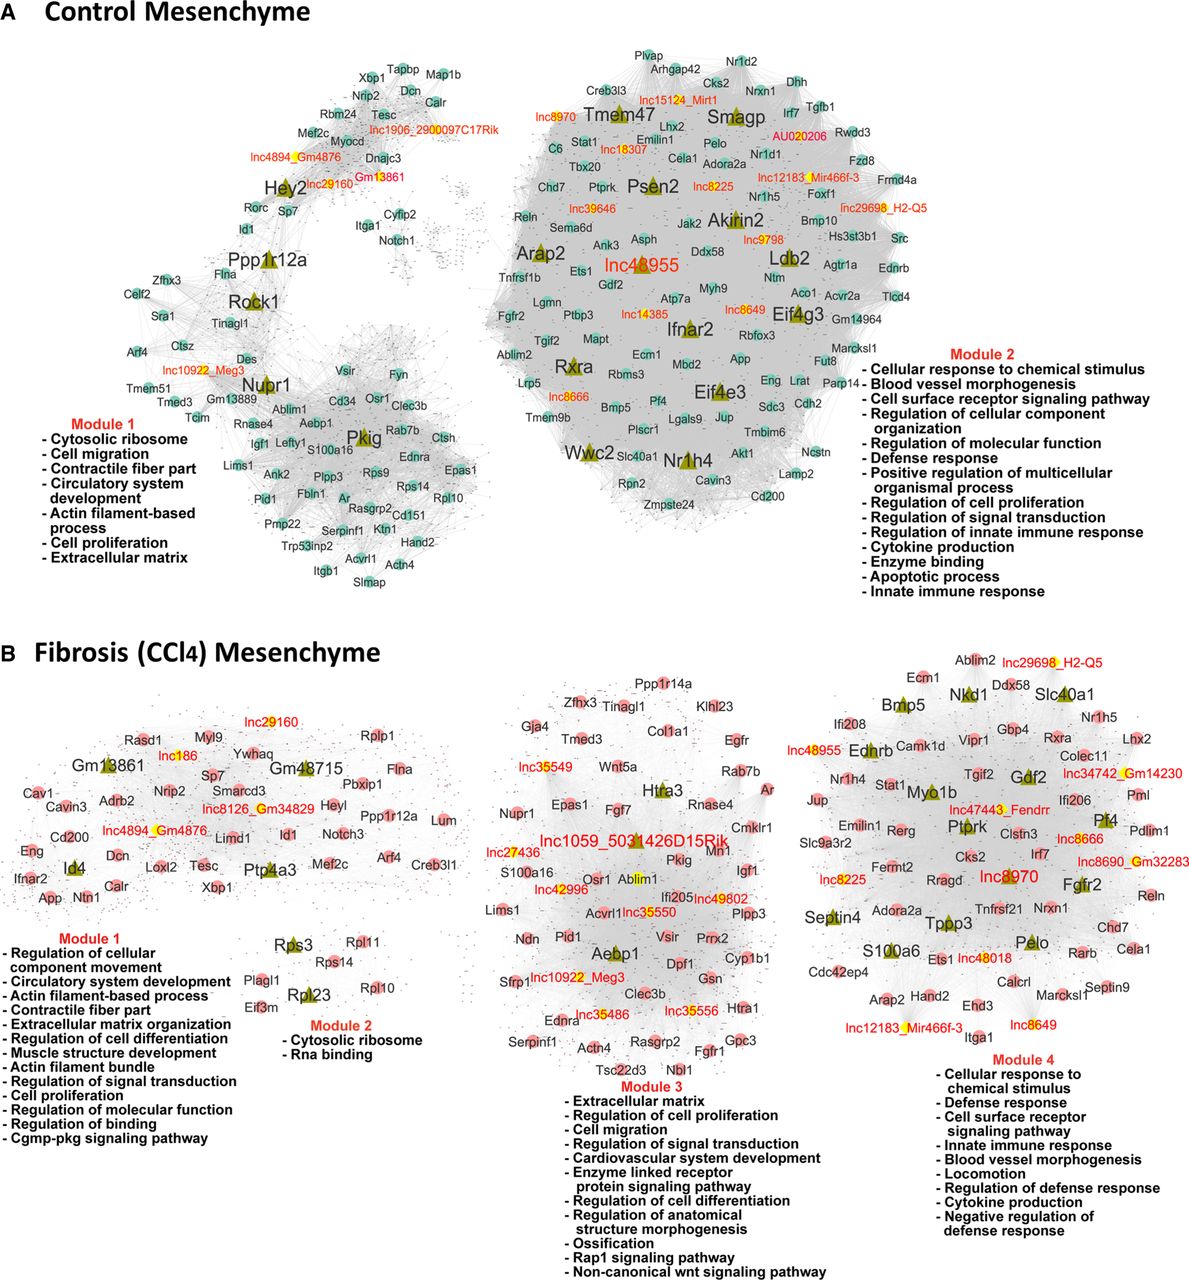
FIGURE 8.
Gene regulatory networks for healthy liver (A) and CCl4-induced fibrotic liver (B). Shown are BigSCale2 networks, as in Figure 6, with nodes representing network-essential regulatory genes (circular nodes, with lncRNAs shown as yellow nodes) predicted based on top network metrics. Triangular nodes indicate master regulators. The networks are subdivided into gene modules, which were enriched for the biological functions listed. See Supplemental Table S5.




