


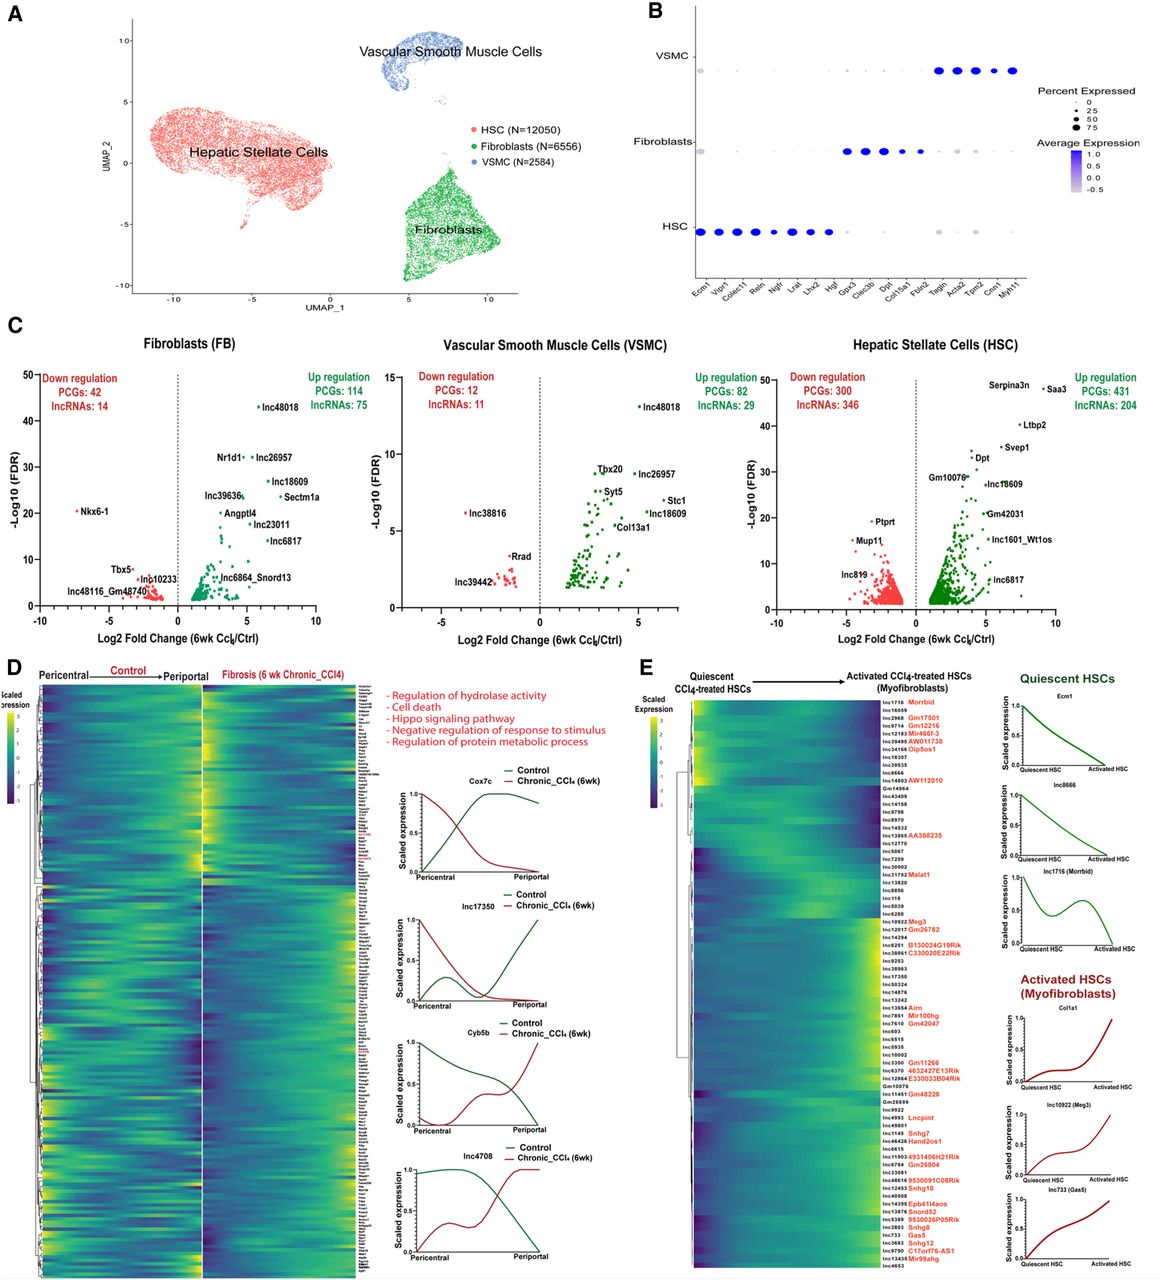
Mesenchymal cell lncRNAs and PCGs perturbed in CCl4-induced fibrotic mouse liver. (A) UMAP showing 21,190 cells comprised of three hepatic mesenchyme subpopulations aggregated from healthy liver (11,710 cells) and fibrotic mouse liver (6 wk CCl4 exposure; 9480 cells), with total cell numbers indicated for each cluster (Supplemental Table S1H). (B) Dot plot showing average expression of mesenchymal cell subpopulation marker genes (Dobie et al. 2019). Dot size is proportional to the percentage of cells expressing each marker gene. (C) Volcano plots showing differentially expressed genes in each cell cluster at log2 |fold-change| > 1 and FDR < 0.05, displayed as −log10 value on y-axis. (D) Matched heatmaps of genes expressed in HSCs that are differentially zonated between control and fibrotic mouse liver (at FDR < 0.001), with perturbed pathways based on DAVID functional enrichment analysis. (Right) Zonation profiles for select genes whose zonation pattern is perturbed by CCl4 exposure. (E) Heatmap showing relative expression of lncRNAs that are differentially expressed between quiescent pericentral HSCs and myofibroblasts from CCl4-exposed mouse liver mesenchymal cells. See Supplemental Figure S5B. (Right) Expression patterns for select genes. Cell identities were verified using the uninjured HSC marker gene Ecm1 and the profibrogenic marker gene Col1a1 (right).




