


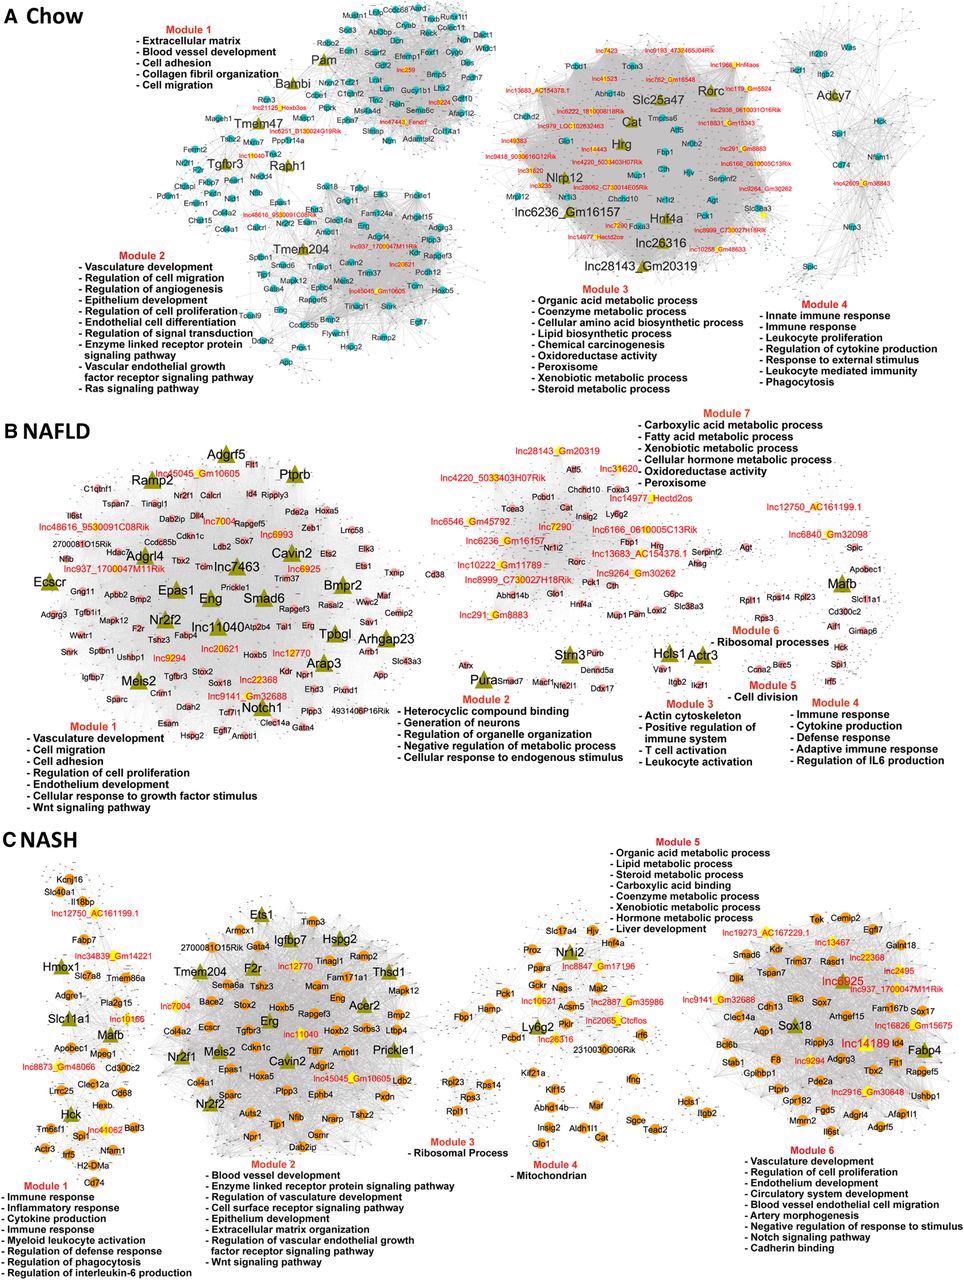
Gene regulatory networks for healthy, NAFLD, and NASH liver. BigSCale2 networks based on scRNA-seq data for chow-fed (A), NAFLD (B), and NASH (C) mouse livers, where PCGs and lncRNAs are nodes, and the edges between genes are correlation values based on an adaptive threshold. Nodes displayed here represent network-essential/regulatory genes (circular and diamond-shaped nodes, with lncRNAs nodes colored yellow), as predicted based on top network metrics. Triangular nodes represent master regulators (predicted to regulate the network-essential regulators) and are defined as nodes (genes) with high network centrality metrics calculated for subnetworks extracted from all top 100 ranked PCG nodes plus all top 50 ranked lncRNA nodes. The networks are subdivided into gene modules that are enriched for the biological functions listed. Also see Supplemental Table S5.




