


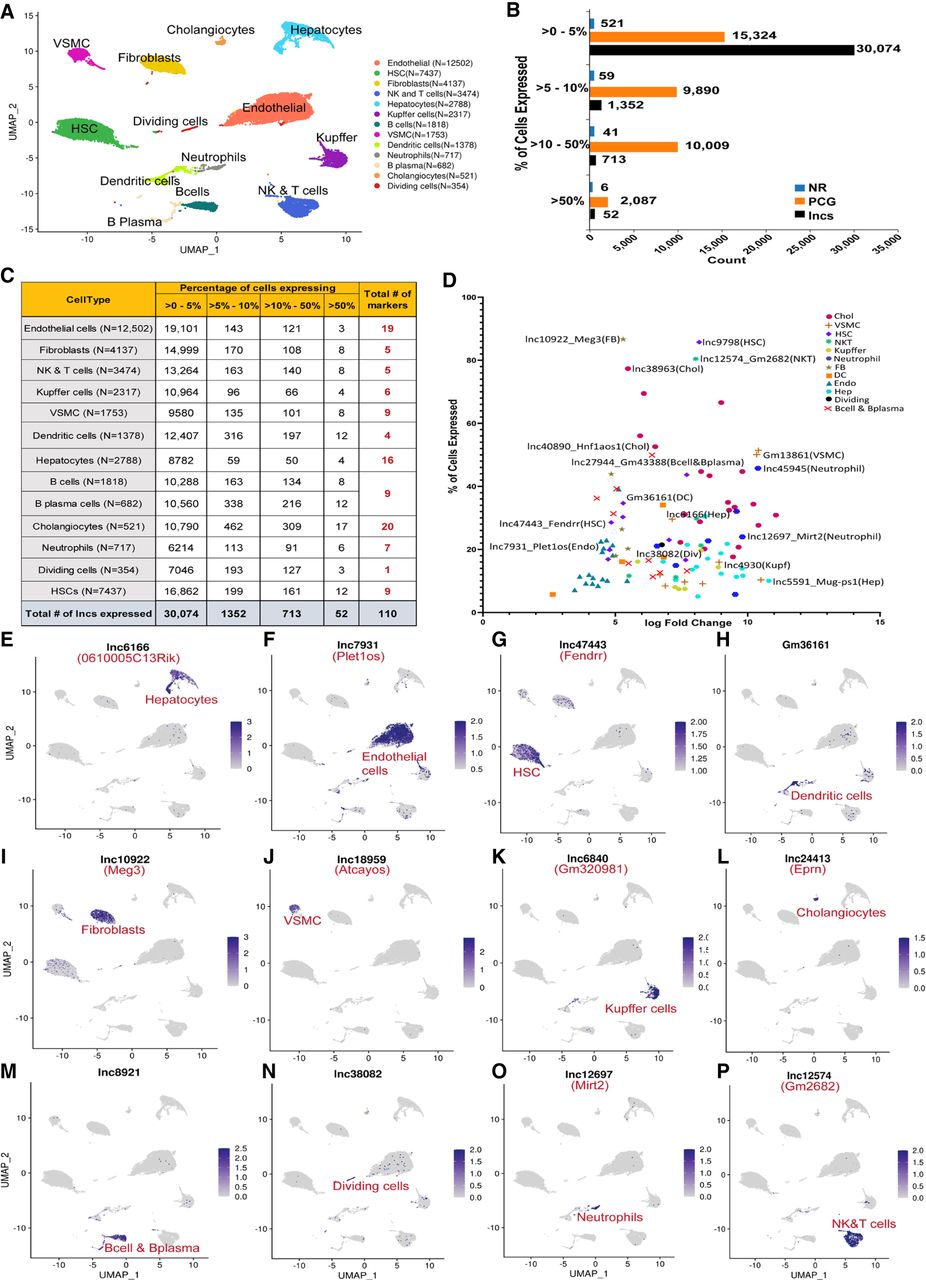
LncRNA detection in hepatic subpopulations and cell type-specific markers. (A) UMAP of liver cell clusters based on 39,878 single-cell transcriptomes integrated across four scRNA-seq data sets. Cell counts for each cell type are indicated in parentheses and in Supplemental Table S1H. (B) Bar plots indicating number of genes in the indicated gene classes (lncRNAs, PCGs, other noncoding RNAs [NR]) that are detectably expressed in one or more liver cell types in up to 5% of cells in a cluster, in >5%–10% of cells in a cluster, in >10%–50% of cells in a cluster, or in >50% of cells in a cluster, based on scRNA-seq data sets from healthy (control) adult male mouse liver. (C) Number of lncRNAs detected in each liver cell type, presented as a percentage of cells that express the lncRNA at ≥1 UMI/cell. Thus, 19,101 lncRNAs were detectably expressed in up to 5% of endothelial cells, and three lncRNAs were detected in >50% of endothelial cells. Cell type-specific marker genes for each cell cluster (last column) are based on Supplemental Table S2D. (D) Plot depicting 110 liver cell type-specific marker lncRNAs, from C. X-axis, log2 fold-change value for differential expression of the cluster marker gene lncRNA compared to its expression across all other clusters; y-axis, percentage of cells that express the lncRNA marker (see Supplemental Table S2D). (E–P) Feature plots with examples of lncRNA marker genes for each liver cell cluster. Shown are UMAPs as in A, with color intensity indicating expression level of the indicated marker lncRNA in individual cells.




