


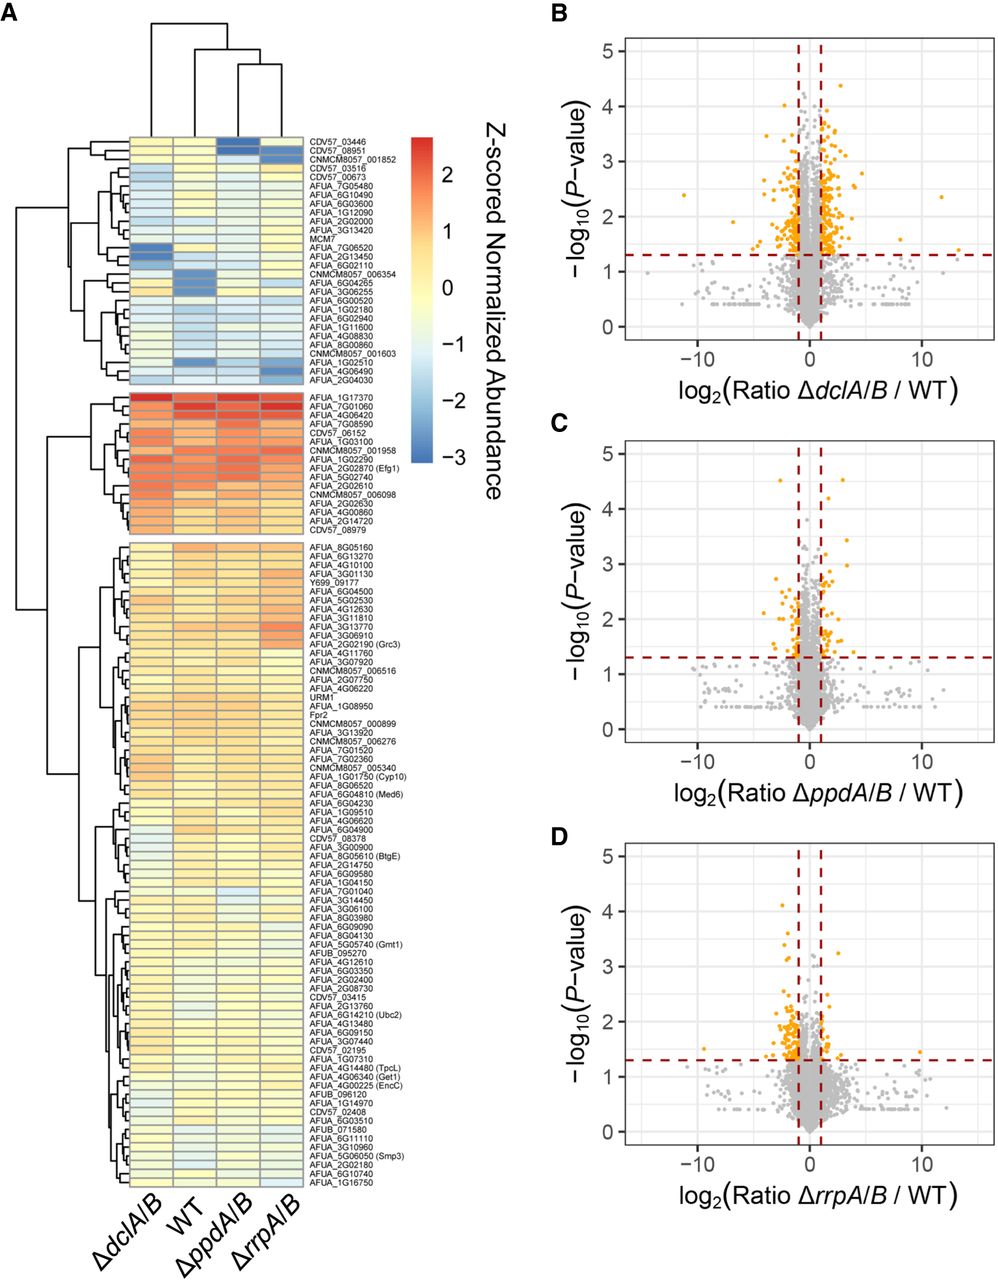
Conidia exhibit an altered proteome different from the transcriptome. (A) Clustered heat map depicting Z-scored normalized average abundance data from conidia of double knockouts and wild type for cases where proteins exhibited at least a log2(FC) = 2 and a P-value of ≤0.05 in one of the conditions. Normalized abundances were determined using area under the curve from label-free quantification. (B–D) Volcano plots showing expression ratio for double knockout compared with wild type for ΔdclA/B (B), ΔppdA/B (C), and ΔrrpA/B (D). The y-axis shows the −log10 transformed P-value, where higher values are more significant. Orange circles show proteins that are at least log2(FC) = 1 and with a P-value of ≤0.05.




