


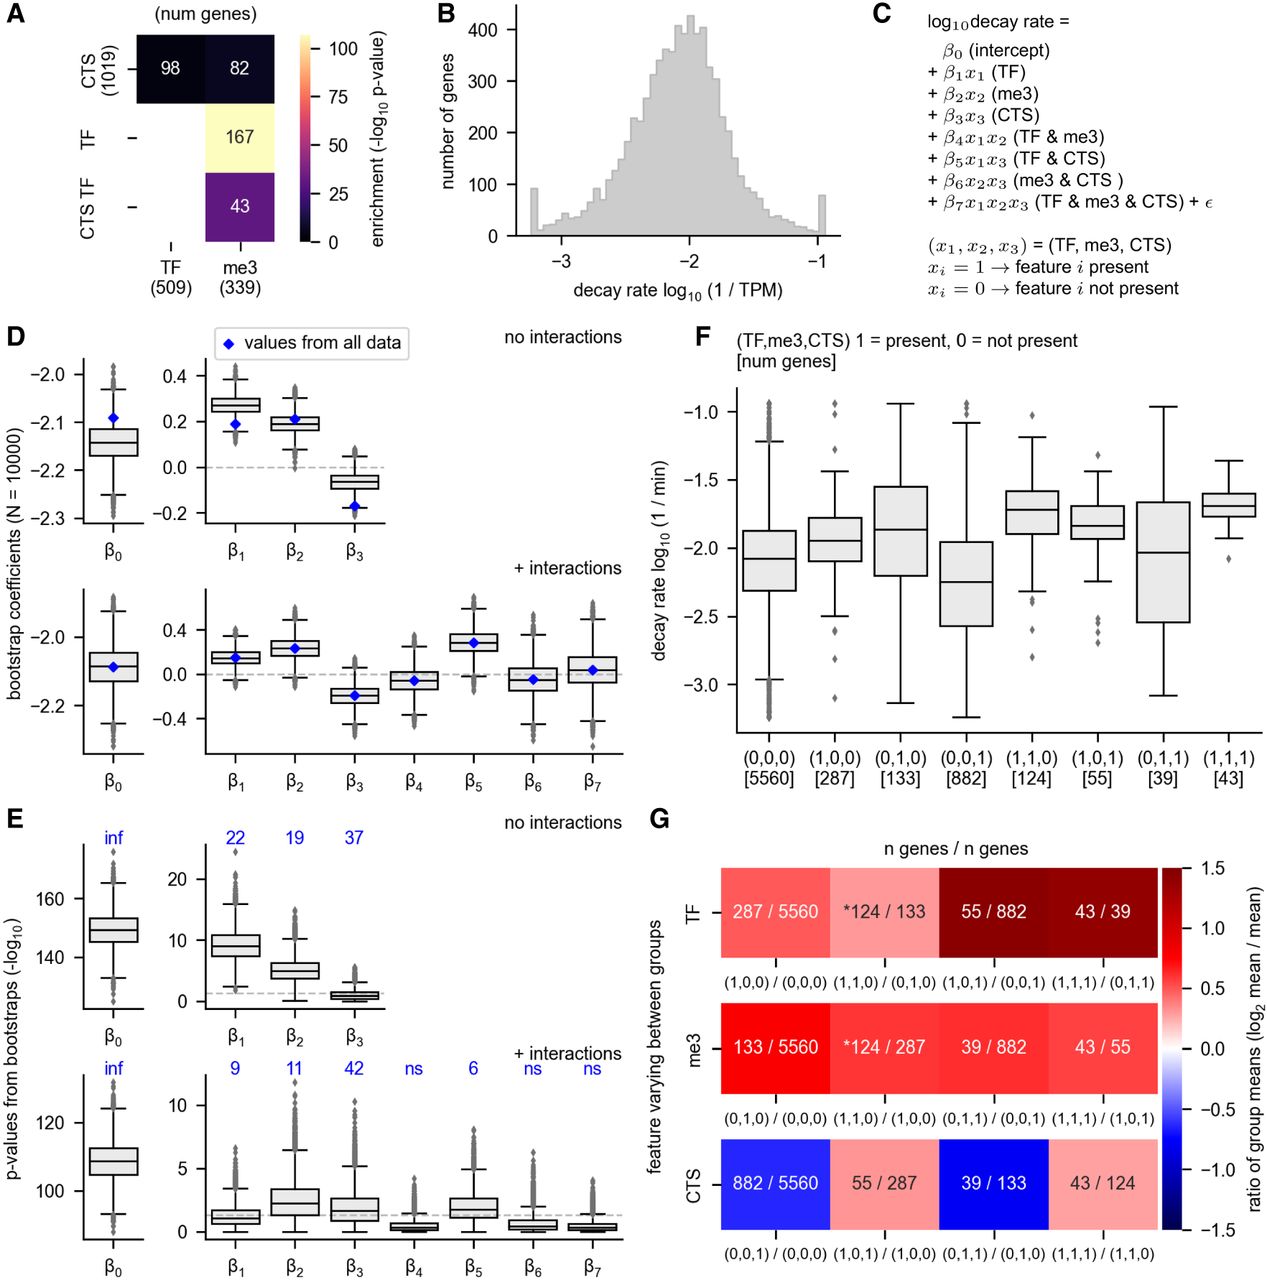
Relationships between RNA decay and gene attributes. The relationship between RNA decay rates and gene membership in the following categories is shown: transcription factor (TF), extended H3K27me3 genes (me3), and cell type-specific genes (CTS). H3K27me3 target genes were defined as those that have H3K27me3 binding sites upstream of, downstream from, and covering the gene body, as specified in Figure 4. (A) The overlap between each gene group is shown. CTS TFs are cell type-specific transcription factor genes. The P-value for the overlap enrichment is shown. Note that the overlap between CTS TF and TF and the overlap between TF and TF is not shown because these categories have 100% overlap by definition. The numbers in parentheses indicate the number of genes in each group. (B) The log transformed and winsorized decay rates are shown. (C) The equation for the linear regression model is shown. The model predicts the log10 decay rate using gene membership in each of the three groups (TF, me3, and CTS) as features. The model was built either with or without interactions between the features. β0–β7 indicate the coefficients, with only β0–β3 determined for the model without interactions. The model without interactions can be derived from this equation simply by setting the interaction coefficients (β4–β7) to 0. (D) A multiple linear regression model was built to predict RNA decay rate as a function of TF, CTS, and H3K27me3 status. The blue diamonds indicate the values determined using all data, whereas the gray box plots show the range of values obtained from subsampling the data set with bootstrapping. Bootstrapping was performed by subsampling each nonoverlapping gene group with a unique combination of factors using a sample size equivalent to the smallest group size (n = 39). Ten-thousand bootstrap samples were taken. (Note that the eight nonoverlapping gene groups are shown in F.) (E) P-values obtained from the linear regression model in D. The P-values are the −log10 value of the original P-values. The P-values derived from the model using the entire data set are written above each coefficient in blue. The P-values corresponding to β0 using the entire data set are 0; thus, the −log10 value is undefined but could be interpreted as an infinitely large number and is indicated by “inf.” (F) The decay rates of all eight possible nonoverlapping groups derived from three possible explanatory features is shown. Each group is indicated by a vector (TF, me3, or CTS), where 1 = present and 0 = not present. (G) For each of the three possible explanatory features (TF, me3, and CTS), the mean change between a group that is positive for the feature is compared with the group that is negative for the feature but is identical with respect to the other features. The overlaid numbers indicate the number of genes in each group. An asterisk marks the comparisons that show the effect of adding either TF or me3 to a group that already has the other feature (i.e., adding TF to a group that is already positive for me3 or vice versa).




