


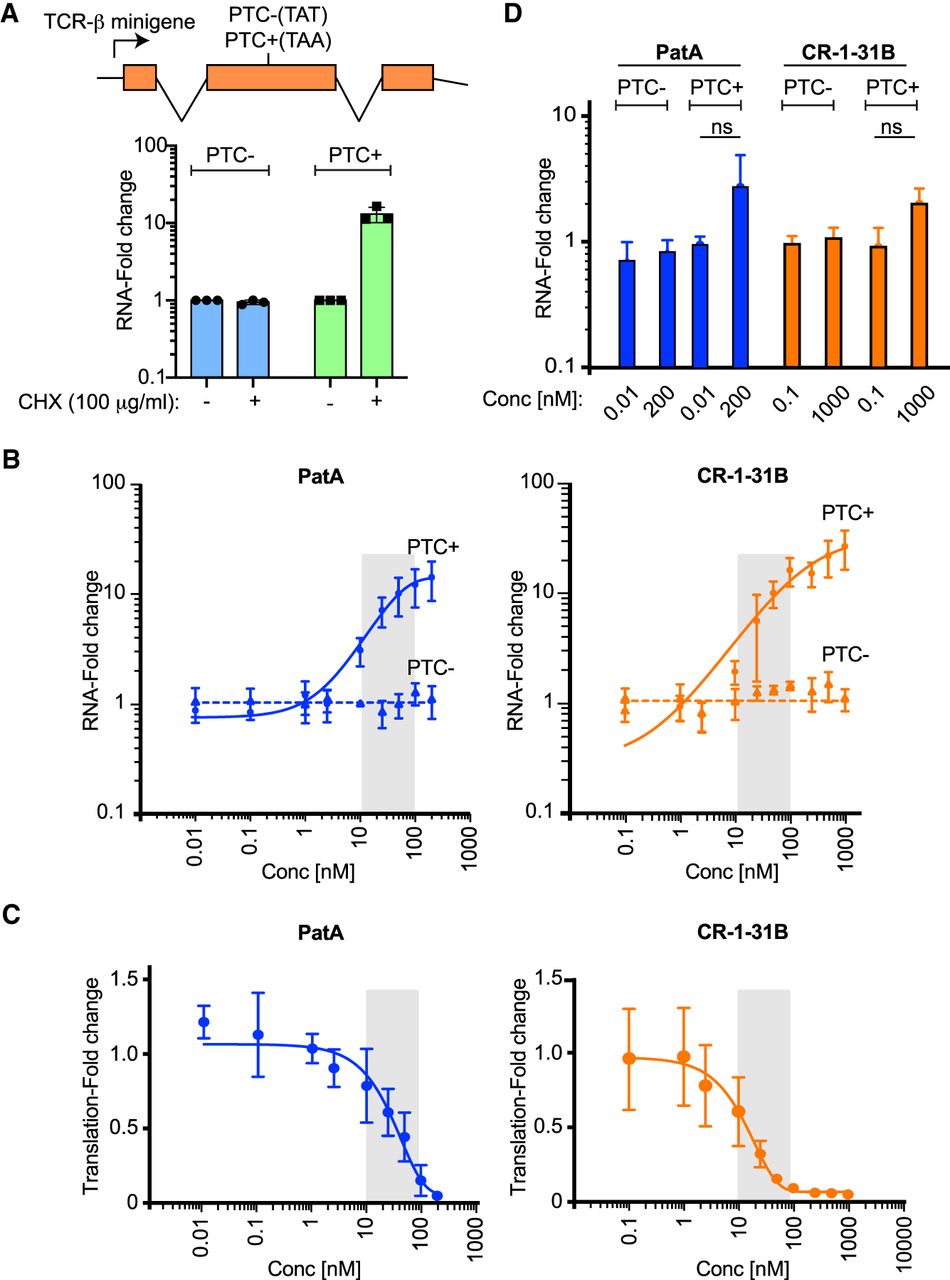
Inhibition of NMD by rocaglates. (A, top) Schematic depiction of reporter construct used in the current study. (Bottom) RT-qPCR results of TCR-β minigene expression from PTC− and PTC+ HeLa cells. Cells were exposed to DMSO or cycloheximide (CHX) for 5 h after which time RNA was extracted and analyzed by RT-qPCR. Values were normalized to β-actin. n = 3 ± SD. (B) RT-qPCR results of TCR-β minigene expression from PTC− and PTC+ HeLa cells exposed to the indicated concentrations of PatA or CR-1-31B for 5 h. Following RNA extraction, levels of TCR-β were assessed by RT-qPCR and normalized to β-actin. n = 3 ± SD. (C) Inhibition of translation following exposure of PTC+ HeLa cells to compound for 1 h. Labeling with 35S-Met/Cys was undertaken for the last 15 min of incubation. Quantitation of 35S-Met/Cys incorporation into nascent protein was determined by TCA precipitation and normalized to total protein levels. n = 3 ± SD. (D) RT-qPCR results of TCR-β minigene expression from PTC− and PTC+ HeLa cells exposed to the indicated concentrations of PatA or CR-1-31B for 1 h. Following RNA extraction, levels of TCR-β were assessed by RT-qPCR and normalized to β-actin. n = 3 ± SD. ns, not significant P > 0.05.




