


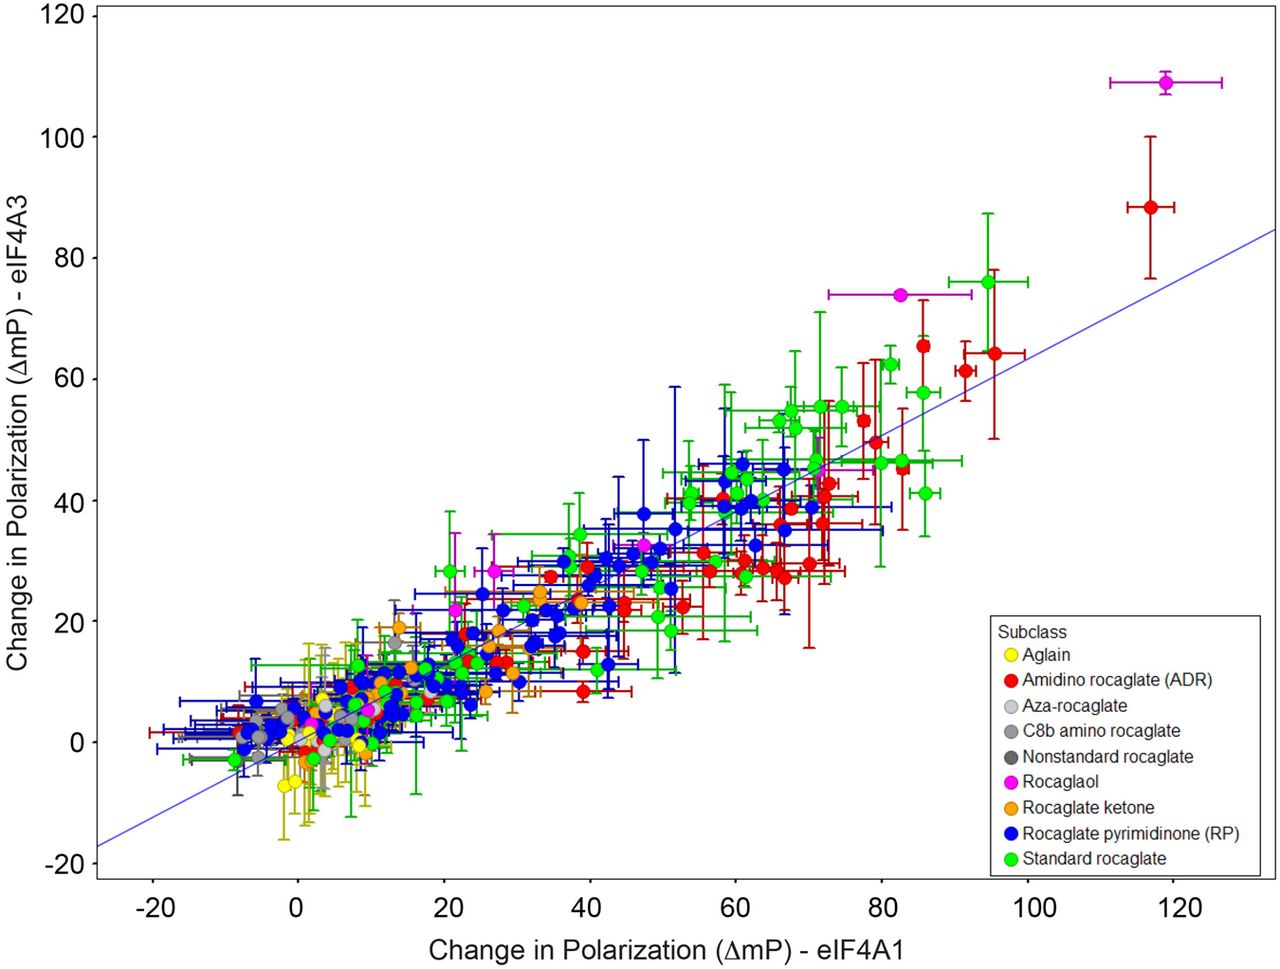
FIGURE 2.
Scatter plot showing correlation between rocaglate-induced clamping to eIF4A1 and eIF4A3. The ΔmP obtained with eIF4A1•AMPPNP•poly r(AG)8 and eIF4A3•AMPPNP•poly r(AG)8 was measured for each compound (10 µM) in duplicate and is plotted. Pearson R2 = 0.89.




