


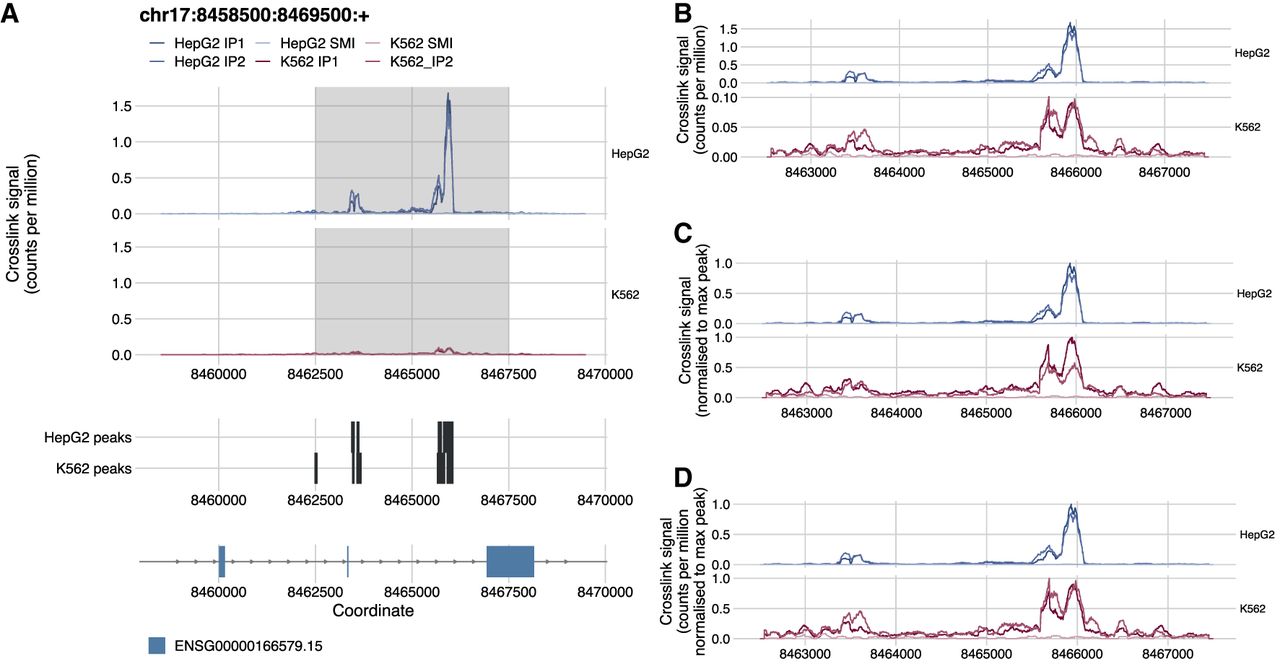
clipplotr’s normalization functions allow exploration of multiple facets of data. (A) The figure generated by clipplotr using data from the ENCODE project showing the region from Van Nostrand et al. (2016) with the CLIP data normalized by library size using ‐‐normalization libsize (default). The region zoomed-in in the subsequent panels is highlighted. (B) The default library size normalization is again used, but additionally the y-axis is scaled independently for each group using ‐‐scale_y. (C) The signal is normalized to the maximum peak in the region for each group using ‐‐normalization maxpeak. (D) The signal is normalized first to library size and then by maximum peak in the region for each group using ‐‐normalization libsize_maxpeak.




