


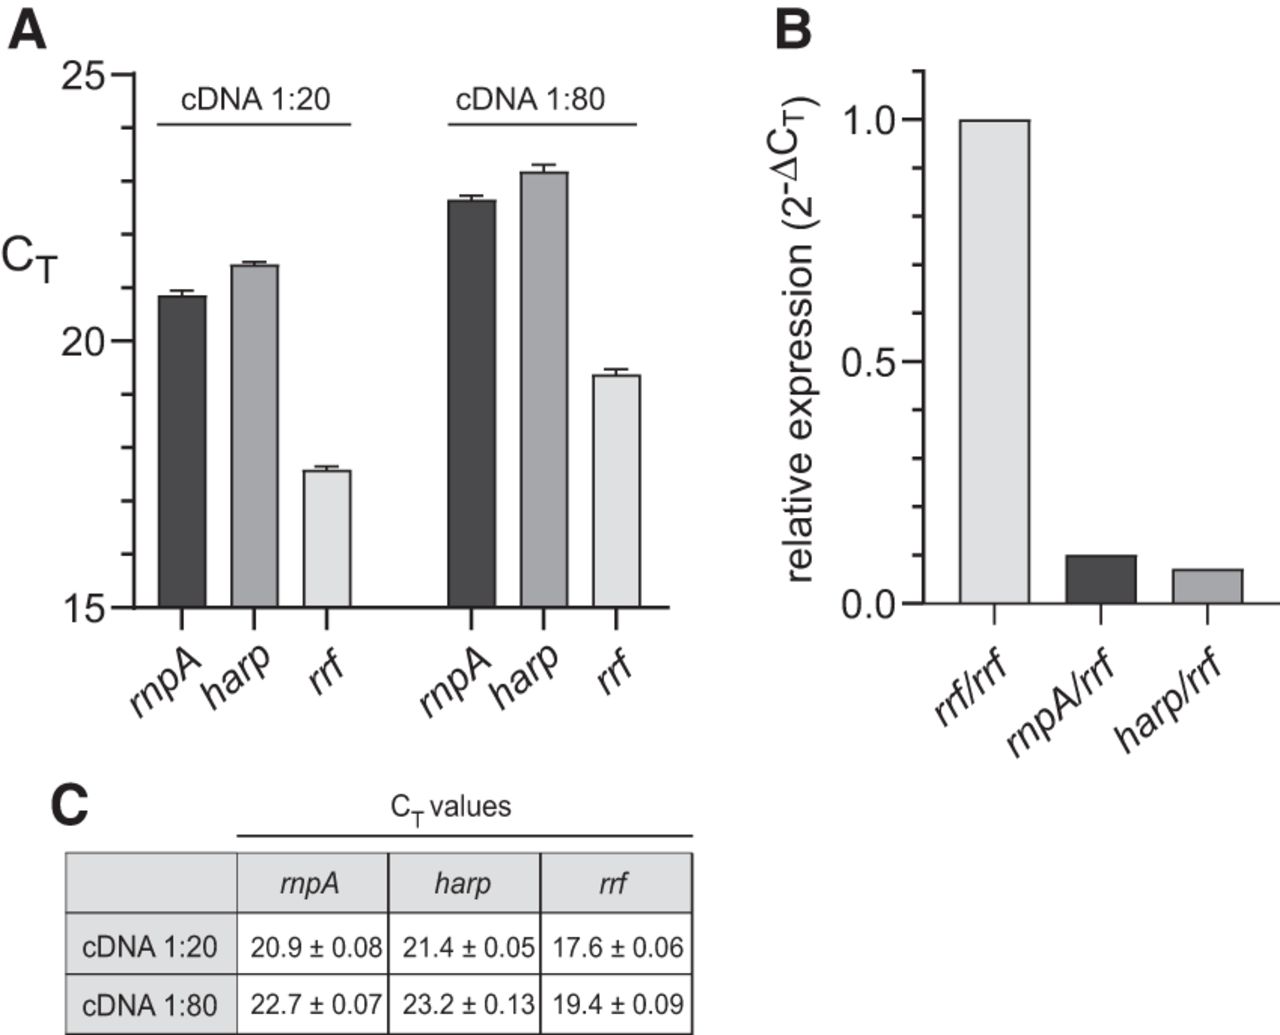
FIGURE 11.
Quantification of rnpA mRNA, harp mRNA and rrf (5S rRNA) RNA levels in total RNA prepared from T. indicus (DSM_15286) cells grown to mid-exponential phase. After reverse transcription, 2.5 µL of 1:20 and 1:80 dilutions (in ddH2O) of the cDNA sample were subjected to qPCR using rnpA-, harp- or rrf-specific primer pairs (Supplemental Table S8) as detailed in Materials and Methods. (A) CT values of rnpA mRNA, harp mRNA and 5S rRNA in T. indicus determined using two different cDNA sample dilutions. (B) Relative levels of rnpA and harp mRNAs normalized to 5S rRNA levels (2−ΔCT; ΔCT = CT(rrf, rnpA or harp) − CT(rrf)). (C) Data table for panels A and B. CT values (±SD) were based on six independent experiments each.




