


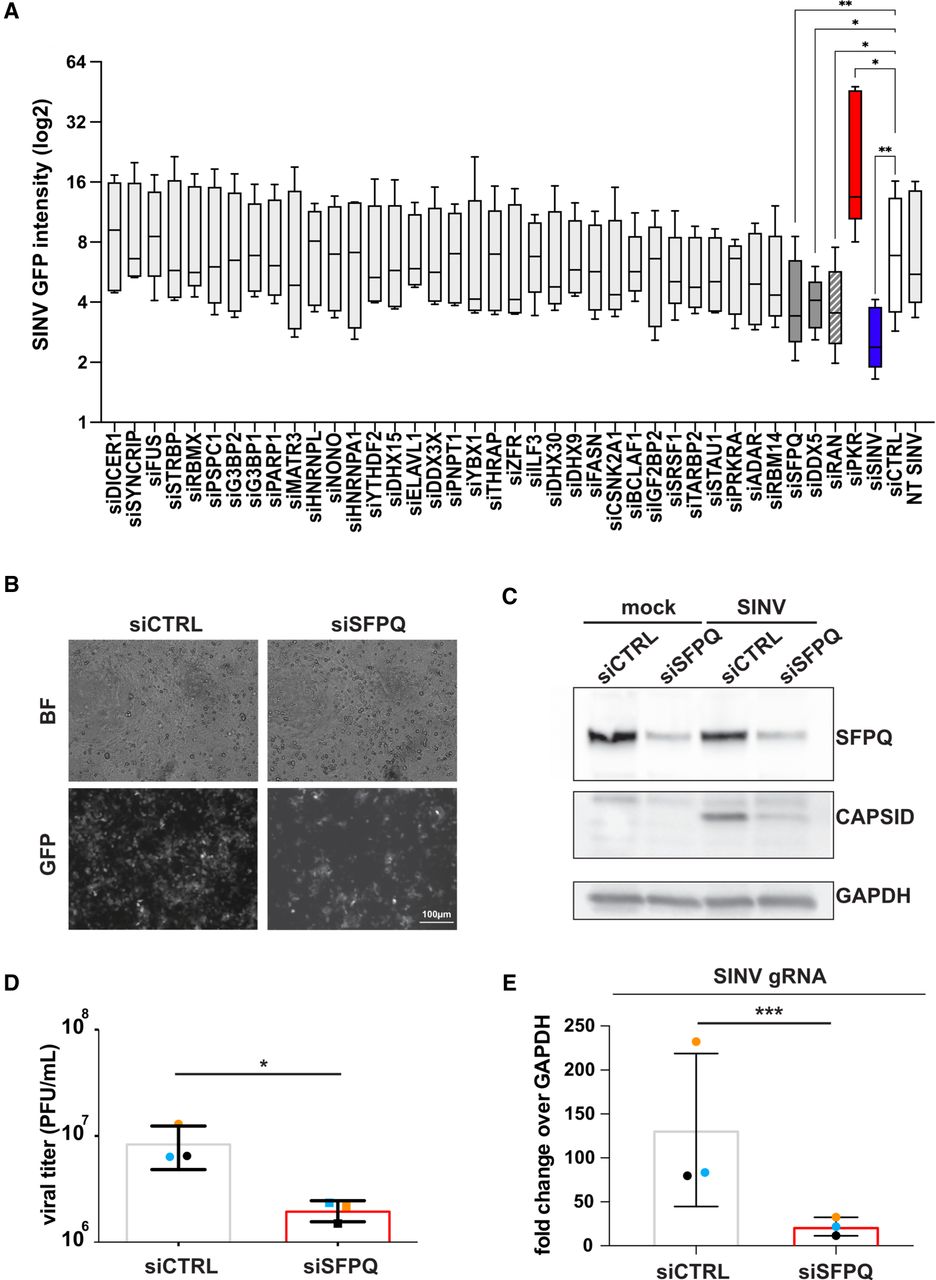
SFPQ knockdown reduces SINV-GFP infection in HCT116 cells. (A) siRNA-based knockdown of 37 proteins enriched in SINV-J2 by DRIMS and measurement of GFP fluorescence intensity in SINV-GFP infected HCT116 cells. The GFP signal is corrected over the background fluorescence (NT mock) for each replicate and expressed in log2. SiRNAs with a significant effect on GFP accumulation relative to siCTRL (negative control, white bar) are shown in dark gray. SiRNAs against PKR mRNA (red bar) or SINV RNA (blue bar) were used as positive controls. NT SINV corresponds to not transfected (NT), SINV infected sample. Data from five independent biological replicates are shown. (*) P < 0.05, (**) P < 0.01, nonparametric Friedman test with multiple comparison. (B) Representative pictures of SINV-GFP infected cells in siCTRL and siSFPQ treated HCT116 cells. GFP expression was measured by microscopy. (BF) brightfield. Scale bar: 100 µm. (C) Western blot performed on mock and SINV-infected cells upon siCTRL and siSFPQ treatment. Antibodies directed against SFPQ and the viral capsid protein were used. GAPDH was used as loading control. (D) Viral production of SINV-GFP upon siCTRL and siSFPQ transfection measured by plaque assay on three independent biological replicates (PFU/mL). (E) RT-qPCR on SINV genomic RNA relative to GAPDH upon siSFPQ treatment compared to siCTRL, in mock and SINV-GFP infected HCT116 cells. Data from three independent biological replicates are shown relative to siCTRL. Each replicate is indicated with a different colored dot in D and E. Error bars in D and E represent the mean ± standard deviation (SD) of three independent experiments, (***) P < 0.001, paired Student's t-test.




