


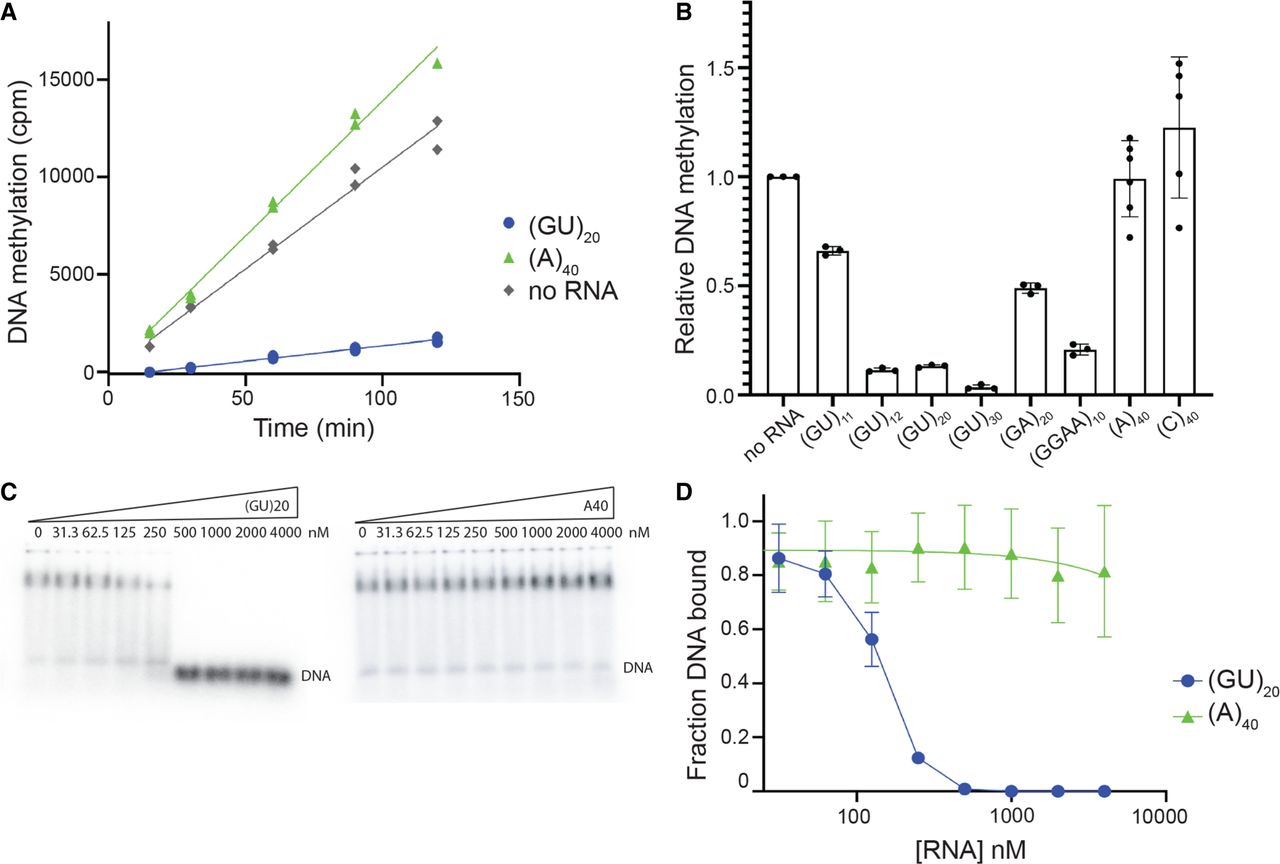
Differential inhibition of DNMT1 methyltransferase activity by different RNAs, with long GU repeats being particularly inhibitory. (A) Time course of DNA methylation with 0.25 µM DNMT1, 1 µM hemimethylated DNA substrate, and 1 µM (GU)20 or (A)40. DNA methylation was measured by incorporation of H3SAM and quantified by counts per minute (cpm). Points represent technical replicates. Entire experiment was repeated three times with similar results. (B) DNA methylation in the presence of 1 µM of each indicated RNA. Methylation levels have been normalized to amount of methylation measured in the “no RNA” sample. Points represent individual measurements, bars give mean value. The entire experiment was repeated four times with similar results, with the exception of (GA)20, which showed moderate inhibition in three out of four experiments and strong inhibition in one experiment. (C) Representative binding competition EMSAs with trace amounts of hemimethylated DNA substrate and 0.5 µM DNMT1 with increasing concentrations of (GU)20 and (A)40. (D) Binding curves for competition EMSAs shown in C, (GU)20 (blue) and (A)40 (green). Points represent mean values and error bars represent SD for n = 3 replicates. (A)40 data points are fit with a simple linear regression (green line).




