


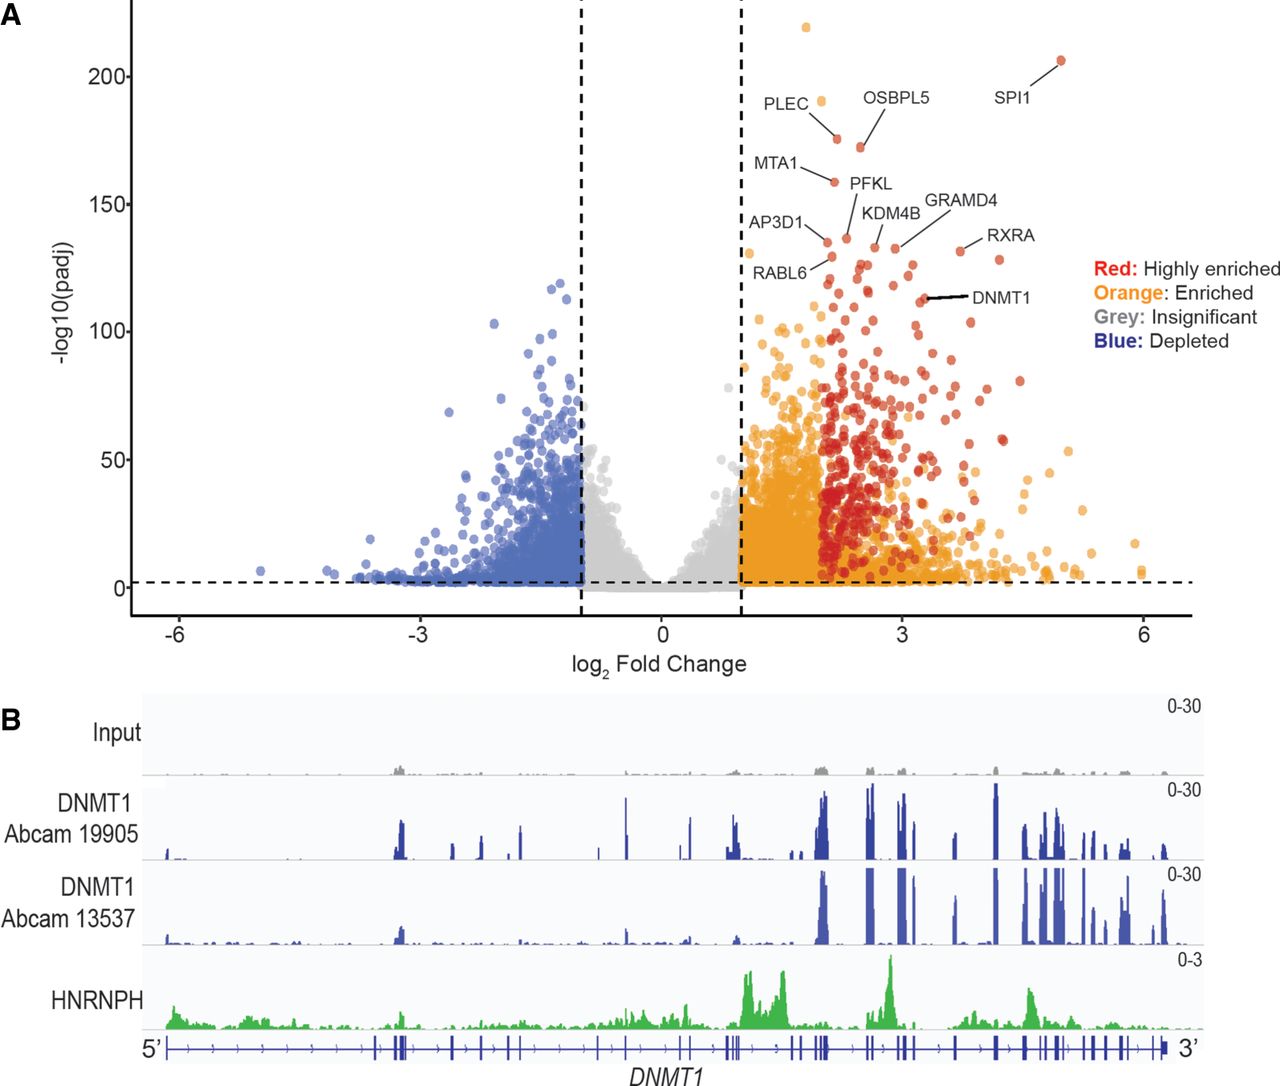
FIGURE 1.
DNMT1 has numerous binding partners including its own mRNA. (A) A volcano plot showing enriched RNAs from fRIP-seq in K562 cells. Highly enriched RNAs (red) have been classified by a Log2FoldChange > 2, baseMean > 100, and adjusted P-value (Padj) < 0.001. Enriched RNAs (orange) are classified by a Log2FoldChange > 1, baseMean > 100, and Padj < 0.001. Nonsignificant and depleted RNAs are shown in gray and blue, respectively. The top 10 enriched RNAs (by Padj) are indicated. DNMT1 (22nd most enriched) is also indicated. (B) Integrated Genomics Viewer (IGV) track of DNMT1 (blue) and HnRNP H (green) fRIP peaks over the DNMT1 mRNA.




