


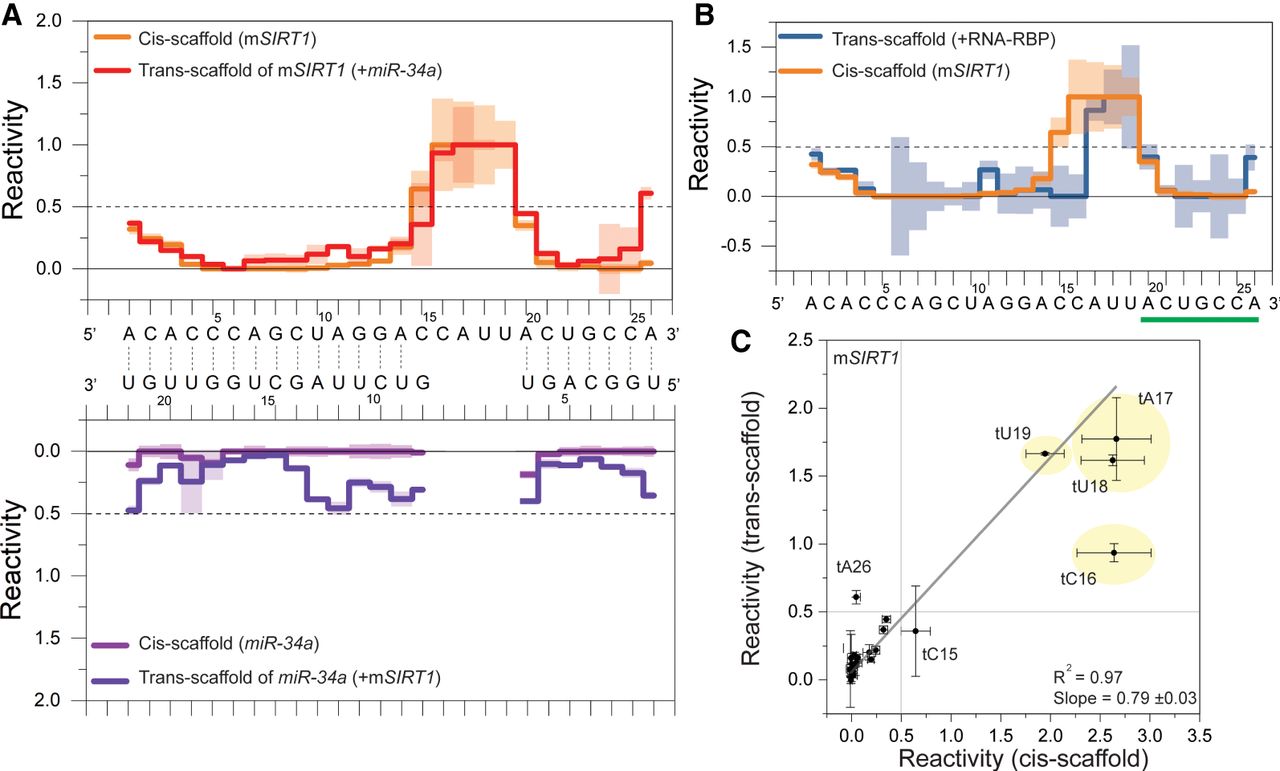
Cis-scaffold comparison to trans-scaffold. (A, top) Reactivity values (three independent replicates) of mSIRT1 in the cis-scaffold (orange) and in trans-scaffold (red). (Bottom) miR-34a reactivity values in the cis-scaffold (light purple) and in the trans-scaffold (dark purple). The base-pairing indicated by lines between the sequences is based on SHAPE reactivity values (RNAprobing, Washietl et al. 2012). (B) Overlay of the reactivity values of the mSIRT1 sequence in the trans-scaffold bound to the miR-34a-AGO2 complex (+RNA-RBP, dark blue) and the mSIRT1 sequence in the cis-scaffold (orange). One standard deviation is indicated with shading. For charts in panels A and B, the observed reactivity values >1 and <0 are set to 1 and 0, respectively. (C) Correlating reactivity values of mSIRT1 sequence from RABS using the trans- (y-axis) versus cis-scaffold (x-axis). The linear fit indicates correlations for most nucleotides, with tC16, tU18, and tA26 as outliers likely due to overall stabilization of the construct and therefore reduced end-fraying. The trans-scaffold reactivity values presented in this figure are not additionally normalized (see Material and Methods).




