


Distinct Gag interaction properties of HIV-1 RNA 5′ leader conformers reveal a mechanism for dimeric genome selection
- 1Institute of Life Sciences, Chongqing Medical University, Chongqing 400016, China
- 2Office of Research Administration, Chongqing Medical University, Chongqing 400016, China
- Corresponding author: wangwei{at}cqmu.edu.cn
-
↵3 These authors contributed equally to this work.
Abstract
During HIV-1 assembly, two copies of viral genomic RNAs (gRNAs) are selectively packaged into new viral particles. This process is mediated by specific interactions between HIV-1 Gag and the packaging signals at the 5′ leader (5′L) of viral gRNA. 5′L is able to adopt different conformations, which promotes either gRNA dimerization and packaging or Gag translation. Dimerization and packaging are coupled. Whether the selective packaging of the gRNA dimer is due to favorable interactions between Gag and 5′L in the packaging conformation is not known. Here, using RNAs mimicking the two 5′L conformers, we show that the 5′L conformation dramatically affects Gag–RNA interactions. Compared to the RNA in the translation conformation (5′LT), the RNA in the packaging conformation (5′LP) can bind more Gag molecules. Gag associates with 5′LP faster than it binds to 5′LT, whereas Gag dissociates from 5′LP more slowly. The Gag–5′LP complex is more stable at high salt concentrations. The NC–SP2–p6 region of Gag likely accounts for the faster association and slower dissociation kinetics for the Gag–5′LP interaction and for the higher stability. In summary, our data suggest that conformational changes play an important role in the selection of dimeric genomes, probably by affecting the binding kinetics and stability of the Gag–5′L complex.
Keywords
INTRODUCTION
At the last stage of the human immunodeficiency virus type I (HIV-1) life cycle, two copies of its genomic RNA (gRNA) are selectively packaged into viral particles (D'Souza and Summers 2005; Kuzembayeva et al. 2014; Bieniasz and Telesnitsky 2018). This is an essential process for viral replication and can potentially be targeted to develop novel therapeutics (Bell et al. 2013; Ingemarsdotter et al. 2018). During packaging, HIV-1 Gag specifically binds to viral gRNA and assembles at the plasma membrane (Jouvenet et al. 2009). In the absence of gRNA, cellular RNAs are randomly packaged (Rulli et al. 2007), but in the presence of gRNA, most viral particles contain two gRNAs (Chen et al. 2009). Since gRNA represents a very small portion of the total cellular RNA pool, the selection mechanism is highly efficient.
The packaging process is initiated by a direct interaction between Gag and a packaging signal (Psi) at the 5′ leader (5′L) of HIV-1 gRNA, which is composed of both the 5′ untranslated region and part of the coding sequence of the gag gene (D'Souza and Summers 2005; Comas-Garcia et al. 2016). Gag consists of matrix (MA), capsid (CA) and nucleocapsid (NC) domains, as well as three smaller peptide regions named spacer peptides 1, 2 (SP1 and SP2). and p6 (Ganser-Pornillos et al. 2008). NC plays a major role in genome selection (Freed 2015; Rein 2019); MA, CA, and p6 are also suggested to be involved (Webb et al. 2013; Kutluay et al. 2014; Dubois et al. 2018; Kroupa et al. 2020). The 5′L of HIV-1 gRNA adopts a branched multihairpin structure and participates in many events of HIV-1's life cycle (Lu et al. 2011b), such as transcriptional activation, primer binding, dimerization, and splicing. (These regions fold into discrete hairpin structures and are named transacting responsive [TAR], primer-binding site [PBS], dimerization initiation site [DIS], and splice donor [SD] hairpins, respectively). Although early studies identified several small pieces of RNA that bind NC in vitro (Guzman et al. 1998; Amarasinghe et al. 2000), a much longer RNA piece is needed to guide heterologous RNA for packaging (Heng et al. 2012; Liu et al. 2017). A minimal region of 5′L required for RNA dimerization, NC binding and packaging has been identified, which is also known as the “core encapsidation signal” (Heng et al. 2012; Ding et al. 2020; Ding et al. 2021).
Gag–RNA interactions have been studied extensively. Gag binds HIV-1 Psi RNA and nonspecific RNA with similar affinity under physiological conditions in vitro (Lu et al. 2011a; Bernacchi et al. 2017; Comas-Garcia et al. 2017). In the presence of high salt or in competing nucleic acids, the Gag–Psi interaction is significantly stronger (Webb et al. 2013; Comas-Garcia et al. 2017). Moreover, gRNA promotes virus-like particle assembly more efficiently in an in vitro assembly assay (Comas-Garcia et al. 2018) and facilitates viral particle formation more efficiently than nonspecific RNAs when expressed at a low level in cells (Dilley et al. 2017).
HIV-1 always packages two copies of its gRNA (Paillart et al. 2004; Russell et al. 2004; Chen et al. 2009), which is critical for the virus to maintain its genome integrity and facilitates recombination by template switching during reverse transcription (Hu and Temin 1990; Rawson et al. 2018). Interestingly, a gRNA containing two packaging signals that can form intramolecular dimers is packaged as a self-dimer (Sakuragi et al. 2001; Nikolaitchik et al. 2013), suggesting that gRNAs are selectively packaged in dimer form. Dimerization is controlled by a conformational switch element at 5′L (Ooms et al. 2004; Lu et al. 2011a; Nikolaitchik et al. 2021; Ye et al. 2022). In one conformation, the initiation codon of gag (AUG) interacts with a region called U5 located between the polyadenylation signal [Poly(A)] and PBS; the palindromic sequence at DIS is exposed to mediate dimerization (Fig. 1A) (hereafter, packaging conformation). In the alternative conformation, the palindromic sequence is sequestered; dimerization is prevented, and gRNA functions as the template for Gag translation (Fig. 1B). Hereafter, this alternative conformation is referred to as the translation conformation. Whether the selective packaging of the gRNA dimer is due to favorable interactions between Gag and 5′L in the packaging conformation, which promotes dimerization, is not known.
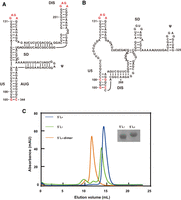
Design and preparation of the RNAs used in this study. (A) 5′LP mimics the packaging conformation of the HIV-1 gRNA 5′ leader. It is derived from nucleotides 105–344 of the NL4-3 strain genome and consists of U5, DIS, SD, Ψ, and AUG (U5: unique 5′; DIS: dimerization initiation site; SD: splice donor; Ψ: packaging signal stem–loop; AUG: start codon of gag). The palindromic sequence at DIS was mutated to GAGA to prevent dimerization. (B) 5′LT mimics the translation conformation. This RNA does not contain AUG and cannot form the U5:AUG interaction required for stabilizing the packaging conformation. The DIS region is retained to interact with U5. (Nonnative residues are in red.) (C) 5′LP and 5′LT showed good homogeneity on urea-PAGE and were eluted as monomers by size exclusion chromatography (SEC). A variant of 5′LP (5′LP-dimer) that retains the palindromic sequence was eluted as a dimer on SEC, as expected.
Although the dimeric 5′L in the packaging conformation is able to bind more NC molecules (∼32) than the monomeric 5′L in the translation conformation (∼7) (Lu et al. 2011a), the difference in their NC binding affinity is very small (5′L dimer: 71 nM; monomer: 87 nM) and seems unlikely to account for the almost exclusive packaging of the gRNA dimer (Chen et al. 2009). Here, we show that Gag associates quickly with 5′L in the packaging conformation (hereafter 5′LP, P for packaging) and dissociates from it slowly, whereas Gag binds more slowly to 5′L in the translation conformation (hereafter 5′LT, T for translation) but dissociates from it faster. Moreover, the complex of Gag and 5′LP is more stable in high salt than the complex of Gag and 5′LT. The favorable binding properties of 5′LP may allow Gag to nucleate more efficiently, facilitating virus particle assembly. Finally, we show that the higher stability as well as the faster association and slower dissociation kinetics for the Gag–5′LP interaction are mainly attributable to the NC–SP2–p6 region of Gag. These results suggest that the Gag–RNA binding kinetics and the complex stability could play a role in the selective packaging of dimeric HIV-1 genomes.
RESULTS
RNA constructs used for in vitro binding assays
We designed two RNA constructs to mimic the alternative conformations of the 5′L based on published works (Lu et al. 2011a; Keane et al. 2015; Brigham et al. 2019). To stabilize the packaging conformation, we used 5′LP, an RNA derived from gRNA nucleotides 105–344 of the HIV-1 NL4-3 strain. The TAR, Poly(A) and PBS regions were not included in 5′LP, since RNA lacking these regions exhibits dimerization and NC binding properties similar to those of the intact 5′L and is readily packaged (Heng et al. 2012; Ding et al. 2020; Ding et al. 2021). The palindromic sequence in the DIS loop was replaced with a GAGA tetraloop (single-letter abbreviations for the nucleic acids: A, adenosine; G, guanosine; C, cytosine; U, uridine) to avoid RNA dimerization. This modification does not affect NC binding (Keane et al. 2015) and facilitated our analysis of the effect of RNA conformations on the Gag interaction. In addition, to stabilize the long-range interactions between U5 and AUG, the nucleotides U105 and G344 were replaced with G and C, respectively (Fig. 1A). To mimic the translation conformation, we used an RNA corresponding to nucleotides 105–325 of the NL4-3 gRNA, named 5′LT. This RNA does not contain the initiation codon of gag and cannot form the U5:AUG interaction, which is required for the packaging conformation. The DIS region was retained to interact with U5 (Fig. 1B). G108 in U5 and C258 in DIS were mutated to C and G, respectively, to prevent RNA dimerization and maintain the U5:DIS interaction. The oligomerization states of 5′LP and 5′LT were confirmed by size exclusion chromatography (SEC) (Fig. 1C).
5′LP is highly similar to a previously studied RNA known as the “core encapsidation signal” (ΨCES) (Keane et al. 2015). The only difference is that 5′LP does not contain the nucleotide C345 at the 3′ end of ΨCES. Since the structure of ΨCES has been studied by nuclear magnetic resonance spectroscopy (NMR) and shown to fold into the packaging conformation, 5′LP probably has the same conformation. 5′LT is similar to an RNA named FH238.2M, which was shown to have the translation conformation in a single molecule study (Brigham et al. 2019). Compared to FH238.2M, 5′LT does not contain the Förster resonance energy transfer (FRET) handle (FH) sequence, the PBS region (replaced by a GAGA tetraloop) and the nucleotides 326–356. In addition, U105 and G261 were mutated to G105 and C261 in 5′LT, respectively, to facilitate in vitro transcription and U5:AUG interaction. None of these changes disrupt the base pairing and the long range interactions of FH238.2M (Brigham et al. 2019). Thus, we did not perform further experimental characterization but assumed that 5′LT also has a similar translation conformation.
5′LP and 5′LT showed distinct Gag binding kinetics
The kinetics of the Gag–RNA interaction were studied by biolayer interferometry (BLI). In the BLI experiment, RNA molecules were first immobilized on the biosensors. When a protein binds, the thickness of the biolayer increases with time, which can be measured in real time by interferometry. To immobilize 5′LP and 5′LT on the biosensor, the sequence 5′-GGTTGGAGGTTATGGAGCA-3′ was added to the 5′ end of the RNAs (Brigham et al. 2019). When annealed to a biotin-labeled 19 nt DNA handle (5′-TGCTCCATAACCTCCAACC-biotin-3′), 5′LP and 5′LT can be immobilized on a streptavidin (SA) biosensor for BLI analysis (Fig. 2A). This immobilization strategy was used in a previous single-molecule study (Brigham et al. 2019) and did not seem to affect the conformation of the immobilized RNA.
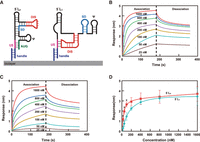
The 5′L conformers showed distinct Gag interaction kinetics. (A) 5′LP and 5′LT were immobilized on biosensors using a biotin-labeled 19-nt oligonucleotide handle. A 5′ sequence complementary to the DNA handle was added to the 5′ ends of the two RNA molecules. Varying amounts of Gag were incubated with 5′LP (B) and 5′LT (C) on biosensors, and the association and dissociation processes were monitored continuously by biolayer interferometry. (D) The responses at the end of association (i.e., 175–180 sec) were plotted versus Gag concentrations. Data are means of at least three independent experiments. Error bars represent standard deviations. (*) Student's t-test, P < 0.05.
Gag binds both 5′LP and 5′LT (Fig. 2B,C). At all Gag concentrations, the equilibrium responses for the Gag–5′LP interaction were higher than those for the Gag–5′LT interaction (Fig. 2D). The response in BLI experiments is a measure of the biolayer thickness at the biosensor surface. Since similar amounts of 5′LP and 5′LT were immobilized (∼0.1 nm) (Supplemental Fig. S1), the higher response observed for the Gag–5′LP interaction suggests that more Gag molecules bound to 5′LP than 5′LT under comparable conditions.
BLI sensorgrams cannot be fitted by a simple 1-to-1 binding model, probably due to the complex Gag–RNA interaction mode. The dimeric 5′-leader contains more than two dozen NC binding sites with different affinities (Ding et al. 2020). In addition, both MA and NC can bind RNA (Webb et al. 2013; Kutluay et al. 2014). To simplify the analysis, we fit data only at low Gag concentrations (<400 nM) to a 1-to-1 binding model to obtain apparent binding and dissociation rate constants. Assuming that the binding site with the highest affinity will be first occupied, these kinetic parameters likely reflect the properties of Gag interaction with this site. The association rate constant (kon) for the Gag–5′LP interaction is 1.6 × 10⁵ M−1s−1, which is higher than that for the Gag–5′LT interaction (8.6 × 10⁴ M−1s−1). The dissociation rate constant (koff) for the Gag–5′LP interaction is smaller than that for Gag–5′LT, which are 1.6 × 10⁻³ s−1 and 2.8 × 10⁻³ s−1, respectively (Table 1). These results suggest that Gag binds to 5′LP two times faster than to 5′LT. Once bound, the Gag–5′LP complex could have a longer lifetime than the Gag–5′LT complex.
Kinetic parameters for 5′LP and 5′LT determined by BLI
Gag–5′LP interaction is more stable in the presence of competitive agents
To investigate the effects of 5′L conformation changes on Gag binding affinity, we performed direct binding measurements using fluorescence anisotropy (FA) in which fluorescently labeled 5′LP or 5′LT was incubated with various amounts of Gag protein (5′L: 10 nM; Gag: ∼2 nM to 2000 nM; the range of Gag: RNA molar ratio: 0.2 to 200). 5′LP and 5′LT were labeled with fluorescein following a published procedure (Pagano et al. 2007; Jones et al. 2013). Although Gag bound to 5′LP and 5′LT with similar affinity in the presence of 50 mM sodium chloride (NaCl) (Fig. 3A), in buffers containing 300 mM and 500 mM NaCl, Gag bound to 5′LP more strongly (Fig. 3B,C). The dissociation constants (Kd) for Gag–5′LP and -5′LT interactions are 55 nM and 82 nM, respectively, at 300 mM NaCl and 508 nM and 1084 nM, respectively, at 500 mM NaCl (Table 2). Although the differences were moderate and not statistically significant (partially due to a weak Gag–RNA interaction at high salt), we consistently observed stronger binding for 5′LP (lower Kd value and greater changes in FA) in the experiment performed on the same day. These results also parallel those of previous in vitro studies, which showed moderate but reproducible differences in the interactions between Gag and various RNAs (i.e., specific vs. non-specific RNAs) (Lu et al. 2011a; Bernacchi et al. 2017; Comas-Garcia et al. 2017).
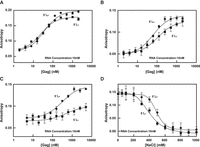
Gag binds to 5′LP with higher affinity at high salt concentrations, and the complex is more stable. The interaction between Gag and 5′LP or 5′LT was measured by fluorescence anisotropy (FA) at 50 mM (A), 300 mM (B), or 500 mM (C) sodium chloride. Data representative of at least three independent trials are shown. (D) In the FA salt titration assay, preformed Gag–5′LP or Gag–5′LT complexes were titrated with increasing concentrations of sodium chloride. FA was measured and fitted to sigmoidal curves.
Binding parameters for 5′LP and 5′LT determined by FA
We further performed salt titration experiments to confirm these observations. In these experiments, preformed Gag–RNA complexes were challenged with increasing concentrations of NaCl, which competed with Gag for RNA binding (Webb et al. 2013). As expected, the Gag–5′LP interaction was more resistant to salt. The NaCl concentrations at which half the Gag–RNA complex dissociates (Na+1/2) were 492 mM and 405 mM for 5′LP and 5′LT, respectively (Fig. 3D). Compared to 5′LT, 5′LP binds Gag more strongly in the presence of a competitor RNA named TAR-Poly(A) (nucleotides 1–104 of HIV-1 NL4-3 gRNA) (Supplemental Fig. S2). These results suggest that the Gag–5′LP interaction is more stable in the presence of salt and probably other competitive agents.
NC–SP2–p6 accounts for the higher stability of the Gag–5′LP interaction as well as the faster association and slower dissociation kinetics
NC plays a major role in the selective packaging of gRNA (Freed 2015; Rein 2019), and p6 may also be involved (Tanwar et al. 2017; Dubois et al. 2018; Sarni et al. 2020). To study whether these domains are responsible for the faster association, slower dissociation kinetics and higher stability of the Gag–5′LP complex, we purified NCp15, which consists of NC, SP2, and p6, and studied its interaction with different 5′L conformers. Similar to Gag, NCp15 binds to 5′LP faster than to 5′LT (Supplemental Fig. S3). The kon of the NCp15–5′LP interaction is 2.8 × 10⁵ M−1s−1, which is approximately four times faster than that of the 5′LT interaction (6.7 × 10⁴ M−1s−1). The koff values for NCp15 dissociation from 5′LP and 5′LT are 4.2 × 10⁻³ s−1 and 5.8 × 10⁻³ s−1, respectively (Table 1), suggesting that NCp15 dissociates from 5′LP slightly more slowly. Thus, the kinetic features of NCp15–5′L interactions partly mirror those for Gag. FA binding experiments further showed that the NCp15–5′LP interaction was less dependent on electrostatic forces. At 500 mM NaCl, the Kd value for 5′LP is 377 nM, slightly smaller than that for 5′LT (508 nM) (Table 2). The difference is modest but reproducible. These data suggest that the NC–SP2–p6 region of Gag likely accounts for the higher stability of the Gag–5′LP interaction as well.
DISCUSSION
In this study, we showed that the conformation of 5′L affects Gag–gRNA interactions. The association rate of the Gag–5′LP interaction is faster than that of the Gag–5′LT interaction. Once complexes form, Gag dissociates from 5′LP more slowly. In addition, 5′LP is able to interact with more Gag molecules than 5′LT under similar conditions, consistent with a previous report (Lu et al. 2011b). The binding kinetics of 5′L in the packaging conformation may allow Gag to nucleate more efficiently to facilitate virus particle assembly (Fig. 4). In situ packaging experiments show that HIV-1 genomes are initially bound by a small number of Gag proteins in the cytoplasm and are then moved to the plasma membrane (Jouvenet et al. 2009; Jouvenet et al. 2011), where additional Gag proteins and cellular factors are recruited for virus assembly and budding (Freed 2015). The slower dissociation rate of the Gag–5′LP interaction may allow Gag molecules to associate with viral RNA 5′L in the packaging conformation for an extended period of time so that additional Gag molecules can be recruited to initiate the assembly process.
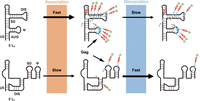
The distinct Gag interaction properties of 5′LP and 5′LT reveal a mechanism for dimeric genome selection. Conformational changes at 5′L affect the Gag interaction. Gag binds to 5′LP quickly and dissociates from it slowly. The Gag–5′LP complex is more stable in the presence of competitive agents. The favorable binding properties of 5′LP may allow sufficient time for Gag to assemble and facilitate HIV-1 assembly. In contrast, Gag binds to 5′LT slowly but dissociates from it quickly. The Gag–5′LT complex is also less stable, which may not favor efficient packaging.
Although 5′LP and 5′LT bind Gag with similar affinity at physiological ionic strength (Fig. 2A), Gag binds 5′LP with modestly higher affinity in the presence of 300 and 500 mM NaCl (Fig. 2B–D). At high ionic strength, the contribution of the electrostatic forces to the Gag–RNA interaction is reduced, whereas nonelectrostatic interactions (hydrogen bonds, π−π stacking interactions or van der Waals forces) play a major role. The higher Gag–5′LP binding affinity at high salt suggests that their interaction depends more on nonelectrostatic binding forces. Previous reports have shown that Gag binds specific RNAs (Psi) with higher affinity than nonspecific RNAs under high salt conditions (Webb et al. 2013; Comas-Garcia et al. 2017), which could account for the more efficient virus-like particle assembly on Psi RNA in vitro (Comas-Garcia et al. 2018) and genomic RNA packaging in cells (Dilley et al. 2017). Similarly, the specific Gag–5′LP interactions may provide an advantage for the selective packaging of gRNA in this conformation.
The BLI and FA data are consistent with a model in which the 5′L conformation has an important role in the Gag–RNA interaction and selective packaging of dimeric gRNA. When 5′L is modified to exist predominantly in the translation conformation, gRNA exhibits severe packaging defects (Lu et al. 2011a). 5′L in the packaging conformation exposes several unpaired guanosines (Gs), which are in base pairs in the translation conformation (Wilkinson et al. 2008; Abd El-Wahab et al. 2014; Kutluay et al. 2014; Keane et al. 2015). These Gs may function as initial Gag interacting sites (Webb et al. 2013; Rye-McCurdy et al. 2016) and are important for gRNA packaging (Nikolaitchik et al. 2020). The difference in the exposure/sequestration status of the specific Gag binding sites may explain the distinct binding properties of 5′LP and 5′LT. The packaging conformation promotes gRNA dimerization, which could lead to the selection of the dimeric genome. At least some gRNAs dimerize at the cellular membrane, suggesting that dimerization per se is not required for gRNA selection (Chen et al. 2016; Ferrer et al. 2016). RNA dimerization does not alter its ability to bind Gag/NC (Webb et al. 2013; Keane et al. 2015; Comas-Garcia et al. 2017). Viral RNA with the DIS loop replaced by a GAGA tetraloop still retains significant packaging activity (Ding et al. 2021). Thus, dimerization may be a consequence of 5′L conformational changes rather than contributing directly to the Gag–5′L interaction.
Although different conformation models have been proposed for the 5′L HIV-1 gRNA, most of them agree that gRNA dimerization is promoted by a long-range interaction between U5 and a region containing the start codon of Gag. In contrast, the DIS loop is likely sequestered when viral RNA is used as mRNA to produce Gag protein, but the exact interaction site of DIS is still under debate (Ooms et al. 2004; Lu et al. 2011a; Kenyon et al. 2013; Nikolaitchik et al. 2021; Ye et al. 2022). HIV-1 gRNA likely exists as a mixture of different conformations (Nikolaitchik et al. 2021), which can switch dynamically (Brigham et al. 2019). In addition, RNA conformation is affected by interacting proteins and/or RNAs, that is, NC and HIV-1 reverse transcription primer tRNALys3 (Brigham et al. 2019). The RNAs used in this study are representative of the diverse conformations that gRNA can adopt. Nonetheless, it provides useful information on the kinetics and stability of the Gag–gRNA interaction.
NC plays a major role in specific Gag–Psi interactions (Webb et al. 2013), but there is evidence that MA, CA and p6 are also involved in the selective packaging of HIV-1 genomes (Webb et al. 2013; Kutluay et al. 2014; Dubois et al. 2018; Kroupa et al. 2020). MA interacts with tRNA to modulate its binding to the cellular membrane during virus budding (Kutluay et al. 2014; Bou-Nader et al. 2021), and the CA–CA interaction was suggested to account for specific binding to gRNA over other cellular RNAs (Comas-Garcia et al. 2017; Kroupa et al. 2020). Although other domains may also be involved in gRNA packaging, we showed that the differences in the Gag–5′L conformer interaction are mainly attributed to the NC–SP2–p6 region of Gag.
In the intracellular environment, the interaction between Gag and gRNA may be regulated by many different mechanisms (Ding et al. 2021; Pereira-Montecinos et al. 2022). For example, a series of reports showed that the fate of HIV-1 RNA transcripts depends on alternative transcription start sites (Masuda et al. 2015; Kharytonchyk et al. 2016). Viral RNAs containing a single 5′ capped guanosine (Cap1G) are specifically selected for packaging in virions, whereas RNAs beginning with two or three capped guanosines (Cap2G and Cap3G) are used as mRNA to produce Gag protein. It was proposed that the fate of viral RNA is determined by the exposure/sequestration status of the 5′ cap structure. The sequestration of the 5′ cap allows viral RNA to escape irreversible capture by cellular RNA processing and translation machinery for selection as HIV-1 genomes (Brown et al. 2020; Ding et al. 2021). It should be noted that alternative transcription start sites also have an important effect on 5′L conformations (Nikolaitchik et al. 2021). The transcript containing Cap1G folds into a conformation similar to that of 5′LP used in this study; the conformations of Cap2G and Cap3G RNAs are similar to that of 5′LT (Brown et al. 2020; Nikolaitchik et al. 2021). Importantly, mutations made around Poly(A) alter the conformation of Cap3G RNA to that of Cap1G RNA and promote Cap3G RNA packaging (Nikolaitchik et al. 2021). The distinct Gag binding kinetics of 5′L conformers and the difference in complex stability suggest a possible mechanism for dimeric genome selection.
MATERIALS AND METHODS
DNA manipulation
The coding sequence of HIV-1 Gag (NL4-3 strain, GenBank accession number AF324493) (Adachi et al. 1986) was optimized and synthesized for Escherichia coli expression (Tsingke Biotech). It was inserted into pET-28a using the NcoI and XhoI restriction sites. The coding sequence for NCp15, which comprises Gag residues 378–500, was inserted into the same restriction sites. Both Gag and NCp15 were fused with a carboxy-terminal 6× His-tag to facilitate purification.
The DNA sequence corresponding to the 5′ leader of NL4-3 gRNA was synthesized and cloned into pUC18 (Tsingke Biotech). The plasmid was further modified by standard quick-change mutagenesis. For 5′LP and 5′LT, the sequence encoding PBS (nucleotides 132–216) and/or the DIS loop (nucleotides 255–263) was replaced by GAGA. A 19-nt sequence (5′-GGTTGGAGGTTATGGAGCA-3′) was inserted at the 5′ end of the RNA-coding sequence for BLI analysis. The primers used for mutagenesis are summarized in the Supplemental Information (Supplemental Table S1).
Protein expression and purification
The recombinant Gag and NCp15 were purified using a previously described protocol (McKinstry et al. 2014). In brief, the expression plasmids were transformed into Escherichia coli BL21(DE3) and cultured in Luria broth (LB) containing 40 µg/mL kanamycin at 37°C. When the cells were grown to an OD600 of ∼0.6, isopropyl-β-d-1-thiogalactopyranoside (IPTG) was added to a final concentration of 0.5 mM. After culturing at 16°C for 16 h, bacteria were harvested by centrifugation (4000 rpm, 4°C, 15 min). Bacteria pellets were suspended in lysis buffer containing 50 mM Tris-HCl pH 8.0, 1 M NaCl, 10 mM β-mercaptoethanol (BME), 2.5 mM dithiothreitol (DTT), 25 mM imidazole, 1% (v/v) Tween-20 and 10% (v/v) glycerol and lysed using a high-pressure continuous flow cell crusher at 4°C. The lysate was centrifuged (18,000 rpm, 4°C, 40 min) to remove insoluble debris. The supernatant was loaded onto a 2 mL HisTRAP fast flow resin (GE Healthcare) preequilibrated with lysis buffer. After washing, target proteins were eluted with buffers containing 50 mM Tris-HCl pH 8.0, 1 M NaCl, 10 mM BME, 2.5 mM DTT, 1% (v/v) Tween-20, 10% (v/v) glycerol, and 200 mM imidazole. Fractions containing Gag were pooled and concentrated using Amicon Ultra centrifugal units (Millipore). The target proteins were then purified by sequential heparin (HiTrap Heparin HP, GE Healthcare) and size exclusion chromatography (SEC, Superdex 200 10/300 column increase, GE Healthcare). The SEC buffer contained 50 mM Tris-HCl pH 8.0 and 1.0 M NaCl. The fractions containing the target proteins were pooled, concentrated to 1–2 mg/mL and snap-frozen in liquid nitrogen before storage at −80°C.
T7 RNA polymerase was expressed in the E. coli BL21 (DE3) strain and lysed via a high-pressure homogenizer in a buffer containing 20 mM Tris-HCl, pH 8.0, 500 mM NaCl, and 2 mM DTT. After centrifugation, the supernatant was loaded onto a Ni-NTA column (GE Healthcare). The column was washed using lysis buffer supplemented with 50 mM imidazole and eluted with the same buffer supplemented with 200 mM imidazole. The eluted protein was further purified by cation-exchange chromatography (HiTrap Capto S HP 5 mL, GE Healthcare) using a linear gradient of 0%–40% buffer A (50 mM HEPES, pH 7.5, 2 mM EDTA, 5% (v/v) glycerol, 2 mM DTT, 75 mM NaCl) in buffer B (50 mM HEPES, pH 7.5, 2 mM EDTA, 5% (v/v) glycerol, 2 mM DTT, 1000 mM NaCl). Finally, the protein was purified by SEC (Superdex 200 10/300 GL, GE Healthcare) using a buffer containing 10 mM Tris-HCl, pH 8.0, 200 mM NaCl, and 2 mM DTT.
Preparation of nucleic acids
5′LP and 5′LT were prepared by in vitro transcription (Milligan et al. 1987) using PCR products of the gene-coding regions. The primers are listed in the Supplemental Information. The products of in vitro transcription were separated by 8% urea polyacrylamide gel electrophoresis (urea-PAGE). The correct RNA bands were excised, eluted in a buffer containing 0.1 M NaOAc, pH 5.1, concentrated, subjected to phenol–chloroform extraction, and precipitated with ethanol at −20°C. The oligomerization state of the RNAs was confirmed by SEC.
5′LP and 5′LT were fluorescently labeled with fluorescein on their 3′ ends as previously described (Pagano et al. 2007; Jones et al. 2013). The concentration and labeling efficiency were determined by measuring the UV absorbance at 260 and 495 nm at pH 9 using the following extinction coefficients: fluorescein, 8.5 × 10⁴ M−1cm−1 (495 nm); 5′LT, 5.21 × 10⁴ M−1cm−1 (260 nm); 5′LP, 5.81 × 10⁴ M−1cm−1 (260 nm). Labeling efficiency was typically between 60% and 100%. The RNAs were divided into aliquots after labeling and stored in diethyl pyrocarbonate (DEPC)-treated H2O in amber tubes at −20 °C.
A biotin-labeled 19 nt DNA handle (5′-GGTTGGAGGTTATGGAGCA-3′) was synthesized and used without further purification (Tsingke Biotech).
FA direct binding assay
Direct FA-binding experiments were performed as previously described (Webb et al. 2013). Varying amounts of Gag were incubated with 20 nM fluorescently labeled RNA in a buffer containing 20 mM HEPES pH 7.5, 1
mM MgCl2, 5 mM BME, 0.02% (v/v) Tween-20, and 50 mM NaCl. Reactions were carried out in the dark at room temperature for 30 min before
FA and fluorescence intensity measurements. All fluorescence measurements were performed on an iD5 plate reader (Molecular
Devices). Binding affinity was determined by fitting FA data to a 1:1 binding model as described previously (Webb et al. 2013) using the following equation:

 where P is the concentration of protein in solution, R is the RNA concentration, and n is the number of protein binding sites per RNA molecule. As the number of binding sites n is not known and cannot be fitted independently, it is conventionally assumed to be n = 1.
FA salt titration assay
The FA salt titration assay was carried out in the same buffer as the direct binding measurements, but the protein concentrations were held constant (500 nM) while the NaCl concentrations were varied from 50 mM to 1 M. This protein concentration was chosen because the RNA binding reached a plateau at this condition in the direct FA binding assay. Following a 30 min incubation of protein and RNA at room temperature, increasing concentrations of NaCl were added and incubated for an additional 30 min before FA measurements. To account for the changes in solution viscosity and RNA conformation due to the increasing NaCl concentration, the FA values of RNA alone were subtracted from the FA values for the protein-containing reactions in each experiment. The corrected data were fitted to a sigmoidal curve using Prism 8 Software to obtain Na+1/2, the concentration of NaCl at which 50% of protein is dissociated from the labeled RNA.
FA RNA competition assay
For competition assays, 30 nM fluorescently labeled TAR-Poly(A) was incubated with 200 nM Gag in 20 mM HEPES, pH 7.5, 1 mM MgCl2, 5 mM BME, 50 mM NaCl, and 0.01% Tween-20. Under these conditions, the difference between the anisotropy of the complex and the anisotropy of the free RNA is large enough that competition binding curves show significant and reproducible changes upon titration with competitor. After incubation of Gag with the fluorescently labeled RNA for 30 min at room temperature, competitor RNA was added, and the mixture was incubated another 30 min at room temperature. To establish points for normalization, the anisotropy of the free RNA in the absence of Gag (Afree) and the anisotropy of the complex without competitor (Abound) were also measured. Competition binding curves were normalized by using the following equation: (A − Afree)/(Abound − Afree) (Jones et al. 2013).
BLI experiment
The BLI analysis was carried out using an Octet K2 system (Sartorius) with streptavidin-coated (SA) biosensors (Sartorius) at 30°C. The biotin-labeled 19 nt handle and 5′LP and 5′LT with 19 nt extensions were mixed, heated at 95°C for 2 min, and incubated on ice for 30 min. Annealed products were purified by SEC (Superdex 200 10/300 increase, GE Healthcare). The annealed products were then immobilized onto the SA biosensors and incubated with 200 µL of protein solutions with various concentrations of Gag or NCp15 in a buffer containing 10 mM Tris, pH 8.0, 300 mM NaCl, 1 mM MgCl2, and 0.02% Tween-20. The association and dissociation processes were recorded and fitted to a 1-to-1 kinetic binding model using Data Analysis 12.0 (Sartorius).
SUPPLEMENTAL MATERIAL
Supplemental material is available for this article.
ACKNOWLEDGMENTS
We thank the Chongqing Medical University Experiment Teaching Center and the College of Clinical Laboratory for use of their instrumentation and technical assistance. The T7 RNA polymerase expression plasmid was a generous gift from Professor Jinzhong Lin of Fudan University. This work was supported by grants from the National Natural Science Foundation of China (81902063), the Natural Science Program of Chongqing Science and Technology Commission (cstc2019jcyj-msxmX0135), the Natural Science Program of Yuzhong District Science and Technology Commission (20190108), and the CQMU Program for Youth Innovation in Future Medicine (W0073).
Footnotes
-
Article is online at http://www.rnajournal.org/cgi/doi/10.1261/rna.079347.122.
- Received July 10, 2022.
- Accepted November 3, 2022.
This article is distributed exclusively by the RNA Society for the first 12 months after the full-issue publication date (see http://rnajournal.cshlp.org/site/misc/terms.xhtml). After 12 months, it is available under a Creative Commons License (Attribution-NonCommercial 4.0 International), as described at http://creativecommons.org/licenses/by-nc/4.0/.




