


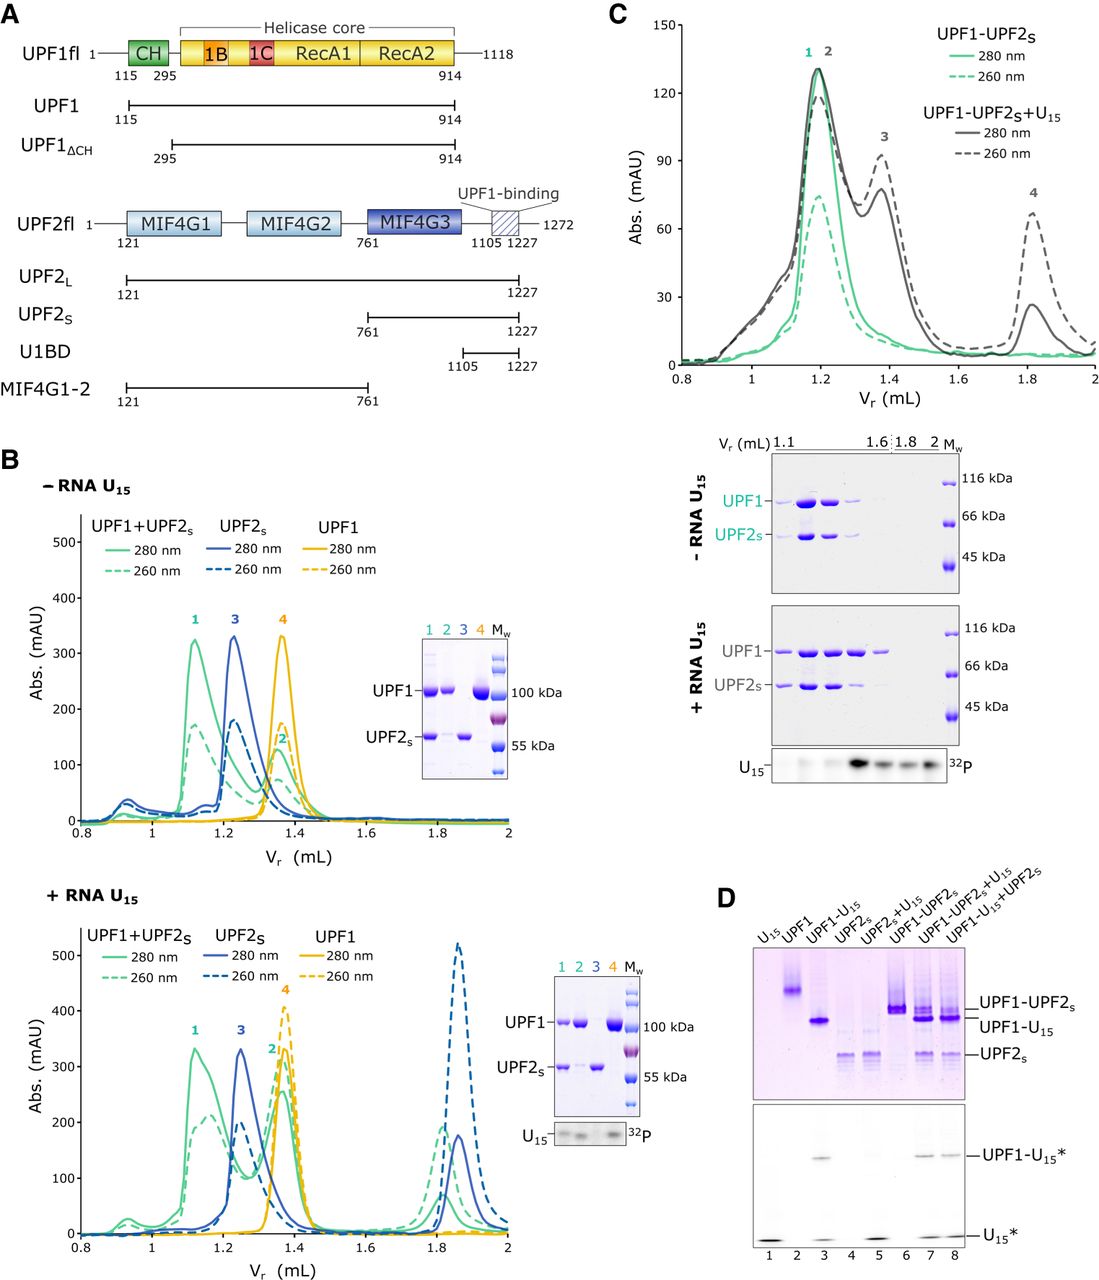
UPF1 does not form a stable ternary complex with UPF2 and RNA in vitro. (A) Schematic of the domain organizations of UPF1 and UPF2. The helicase core comprising the RecA1 and RecA2 domains is colored yellow. The CH domain and auxiliary domains 1B and 1C are shown in green, orange and red, respectively. The MIF4G domains of UPF2 are in shades of blue, while the partially disordered UPF1-binding domain (U1BD) is denoted as a hatched box. The constructs used in this study are represented by black lines under the respective proteins. (B) Analytical SEC and corresponding SDS-PAGE analyses of mixtures of UPF1 and UPF2S, in the absence (top panel) and presence of U15 RNA (bottom panel). SEC runs of individual UPF1 and UPF2S in the absence and presence of U15 RNA have been included for comparison. (Left) Overlay of chromatograms of the UPF1–UPF2S mixtures (green traces), UPF1 alone (yellow traces) and UPF2S alone (blue traces). In this and all other figures for SEC analysis, solid and dashed lines denote absorbances at 280 and 260 nm, respectively. (Right) Corresponding PAGE analyses of the peak fractions of each run. In addition to SDS-PAGE for visualizing proteins, the bottom panel includes a urea-PAGE analysis of the radiolabeled peak fractions to detect U15 RNA. An SDS-PAGE analysis of consecutive fractions of the bottom panel is shown in Supplemental Figure 1A. Addition of U15 RNA to a mixture of UPF1 and UPF2S does not result in a detectable amount of RNA-bound UPF1–UPF2 complex, but rather promotes dissociation of the UPF1–UPF2 complex, resulting in free UPF2S, which leads to a broader peak 1, and free UPF1 that binds the U15 RNA. (C) Analytical SEC analysis of a mixture of a UPF1–UPF2S complex and U15 RNA. (Top) Overlay of chromatograms of the preformed UPF1–UPF2S complex (green traces) and the same complex with U15 RNA added (black traces). (Bottom) SDS- and urea-PAGE analyses of consecutive SEC fractions in order of increasing retention volume, as indicated. Detection of U15 RNA is as described above. Addition of RNA to a stable UPF1–UPF2S complex leads to partial dissociation of the protein complex instead of formation of a stable ternary complex with RNA. The peak between 1.8 and 2 mL in B and C corresponds to excess U15 RNA. (D) Native PAGE analysis of a UPF1–UPF2S complex in the absence and presence of fluorescein-labeled U15 RNA, and a UPF1–U15 RNA complex in the absence and presence of UPF2S. The individual UPF1 and UPF2 proteins as well as the UPF1–UPF2S and UPF1–U15 complexes serve as markers for migration of the protein and RNA components on the native gel. Proteins are visualized by staining with Coomassie brilliant blue (top panel), and the U15 RNA is detected by fluorescence scanning (bottom panel). Asterisks denote the fluorescein label. In solution, UPF1, UPF2S, and U15 RNA always partition into two binary complexes, UPF1–UPF2S and UPF1–U15 RNA. As with analytical SEC (Fig. 1C), no ternary UPF1–UPF2S–U15 complex is detected in these conditions.




