


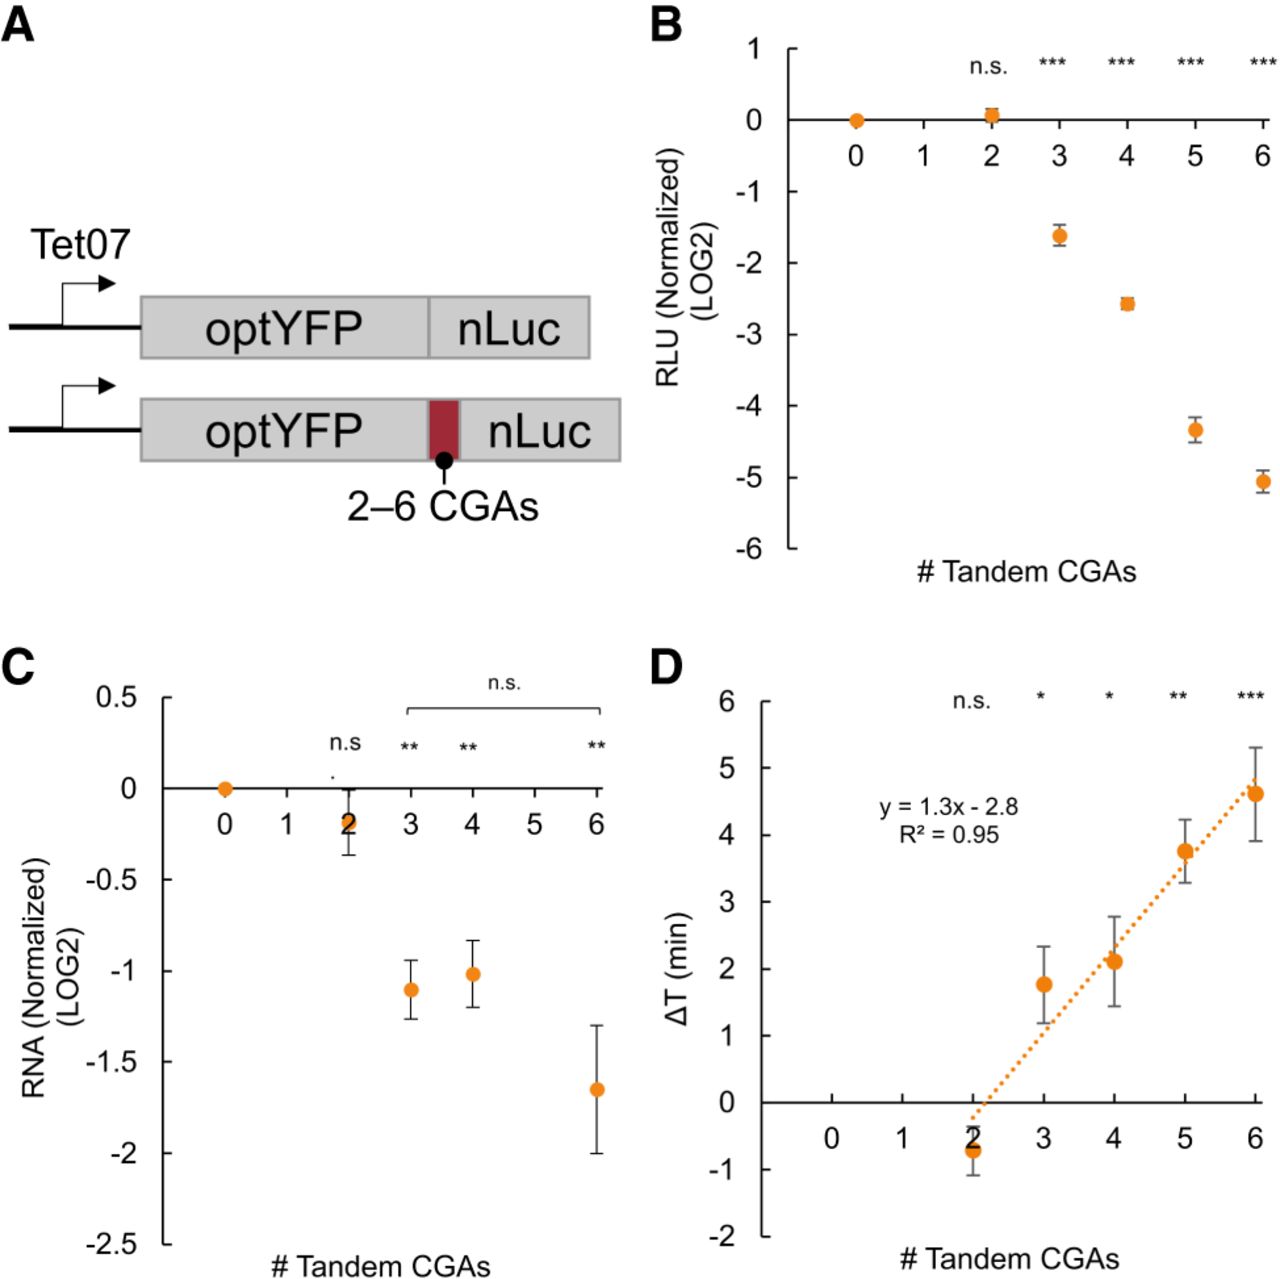
CGA-derived acute stalls negatively impact gene expression and increase elongation time in a dose-dependent manner. (A) Diagram of optimal and CGA-containing constructs. Between two and six CGAs are inserted between the optYFP and nLuc ORFs. (B) Protein expression of CGA constructs at T = 60 min normalized to optimized control (2×CGA n = 10, 3×CGA n = 8, 4×CGA n = 10, 5×CGA n = 5, 6×CGA n = 10). (C) mRNA levels of CGA constructs at T = 60 min normalized to optimized control (n = 3). (C) Elongation delay of CGA-containing constructs compared to optimized control (n = 3). All error bars indicate SEM. All statistical significances were calculated for each construct using two-tailed paired Student's t-test against optYFP control.




