


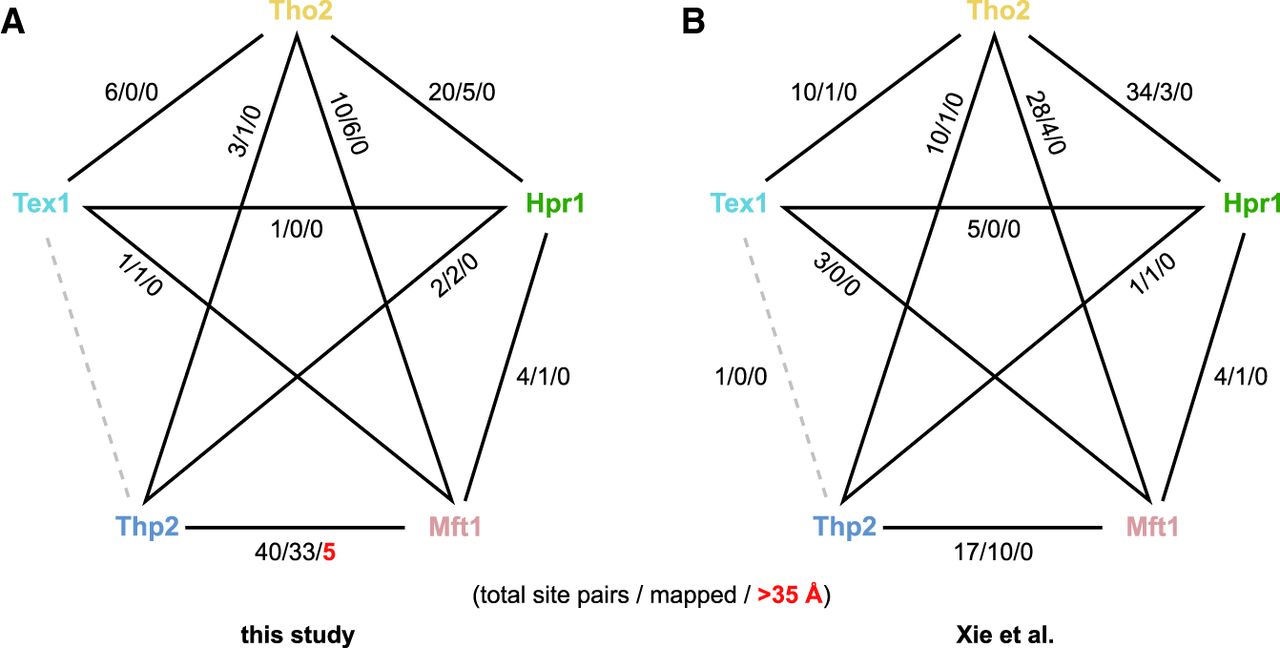
FIGURE 2.
Comparison of intersubunit cross-links. (A) observed in our work, excluding contacts with Sub2, and (B) from cross-linking of the recombinant complex by Xie et al. (2021). Shown are the numbers of nonredundant cross-linking site pairs observed in total for each subunit pair, the number of contacts that could be mapped onto PDB ID: 7apx and therefore connect ordered regions resolved by cryo-EM, and (in red) those that exceed the distance of 35 Å chosen here as an upper threshold for cross-linkable distances. Proteins are color-coded as in Figure 1. A structural model of the dimeric TREX complex (PDB ID: 7aqo) is shown in Figure 3F.




