


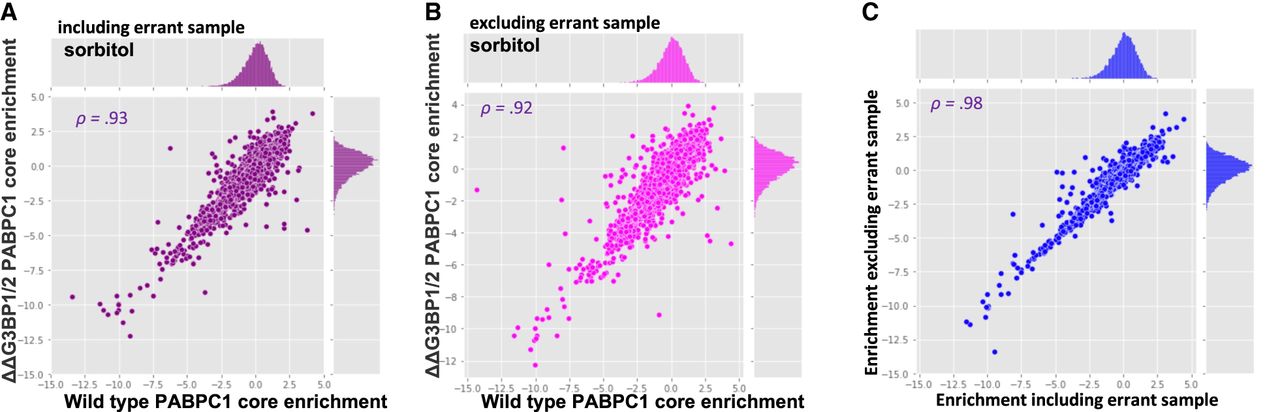
(A) Scatterplot depicting sorbitol-induced PABPC1-purified SG enrichment in ΔΔG3BP1/2 versus WT lines. The misannotated ΔΔG3BP1/2 sample is included in this analysis. (B) Same as A but excluding the errant sample. (C) Scatterplot depicting SG enrichment in corrected analysis versus previous errant analysis.




