


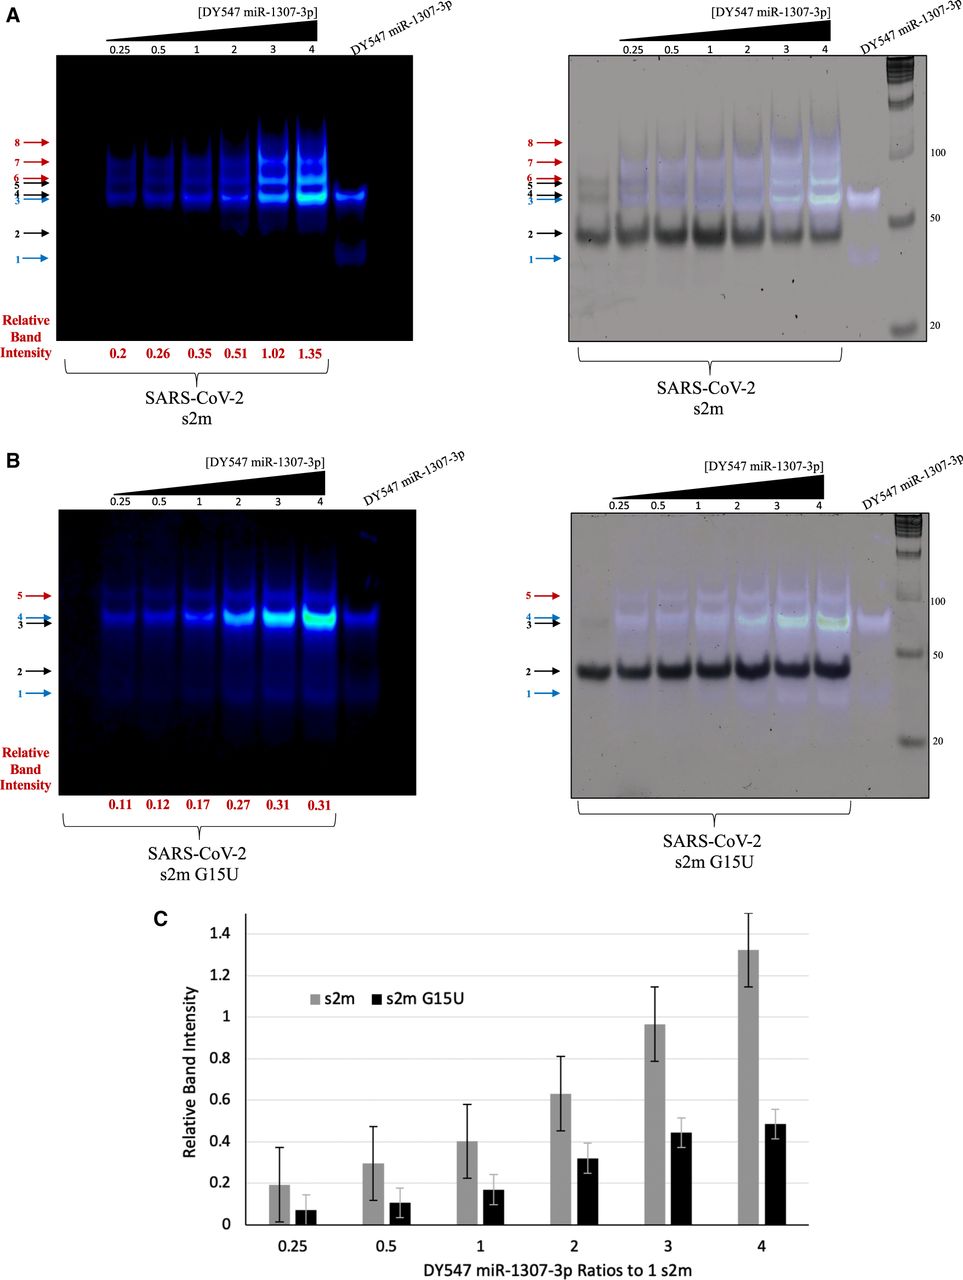
Nondenaturing TBM gel of s2m and s2m G15U binding to a fluorescently tagged DY547 miR-1307-3p in ratios ranging from 1:0.25 to 1:4 s2m:miR in the presence of 1 mM MgCl2. The gels were visualized with a fluorescent imager at 600 nm wavelength (left), stained with SYBR Gold, then overlaid (right). (A) In the s2m binding gels, the blue arrows 1 and 3 correspond to the free DY547 miR-1307-3p in its monomeric and dimeric state, respectively. Arrow 2 indicates the monomeric s2m, whereas arrows 4 and 5 represent the KD and ED, respectively. Bound complex arrows that were used for quantification are indicated in red and show the s2m bound to two miR (arrow 6), the s2m dimer bound to two miRs (one miR to one s2m) (arrow 7), and complexes formed by end-to-end palindromic sequence interactions of the miR bound to the s2m (arrow 8). (B) When the miR is bound to the s2m G15U in TBM conditions, the miR exists as both a monomer and dimer, arrows 1 and 4, respectively. Arrow 2 indicates the monomeric s2m G15U, whereas arrow 3 represents a dimeric form, and these are only present in the right image of the gel stained in SYBR Gold due to it lacking a fluorescent tag. A bound complex between the s2m and two DY547 miR-1307-3p is indicated by arrow 5. Relative band intensities of the bound complexes (red arrows) were calculated using ImageJ as described in the text, and the intensities of the shown gels are listed. (C) The relative band intensities were averaged across the triplicate experiments (representative images shown in A and B). Across all miR ratios, the s2m consistently had a higher relative band intensity of its complexes than the s2m G15U. The standard deviation is included.




