


Examining SRP pathway function in mRNA localization to the endoplasmic reticulum
- Jessica R. Child1,
- Alex C. Hofler2,
- Qiang Chen1,
- Brenda H. Yang1,
- JohnCarlo Kristofich1,
- Tianli Zheng1,
- Molly M. Hannigan1,
- Andrew L. Elles1,
- David W. Reid1 and
- Christopher V. Nicchitta1,2
- 1Department of Cell Biology, Duke University School of Medicine, Durham, North Carolina 27710, USA
- 2Department of Biochemistry, Duke University School of Medicine, Durham, North Carolina 27710, USA
- Corresponding author: christopher.nicchitta{at}duke.edu
Abstract
Signal recognition particle (SRP) pathway function in protein translocation across the endoplasmic reticulum (ER) is well established; its role in RNA localization to the ER remains, however, unclear. In current models, mRNAs undergo translation- and SRP-dependent trafficking to the ER, with ER localization mediated via interactions between SRP-bound translating ribosomes and the ER-resident SRP receptor (SR), a heterodimeric complex comprising SRA, the SRP-binding subunit, and SRB, an integral membrane ER protein. To study SRP pathway function in RNA localization, SR knockout (KO) mammalian cell lines were generated and the consequences of SR KO on steady-state and dynamic mRNA localization examined. CRISPR/Cas9-mediated SRPRB KO resulted in profound destabilization of SRA. Pairing siRNA silencing of SRPRA in SRPRB KO cells yielded viable SR KO cells. Steady-state mRNA compositions and ER-localization patterns in parental and SR KO cells were determined by cell fractionation and deep sequencing. Notably, steady-state cytosol and ER mRNA compositions and partitioning patterns were largely unaltered by loss of SR expression. To examine SRP pathway function in RNA localization dynamics, the subcellular trafficking itineraries of newly exported mRNAs were determined by 4-thiouridine (4SU) pulse-labeling/4SU-seq/cell fractionation. Newly exported mRNAs were distinguished by high ER enrichment, with ER localization being SR-independent. Intriguingly, under conditions of translation initiation inhibition, the ER was the default localization site for all newly exported mRNAs. These data demonstrate that mRNA localization to the ER can be uncoupled from the SRP pathway function and reopen questions regarding the mechanism of RNA localization to the ER.
Keywords
INTRODUCTION
As the site of secretory and membrane protein biogenesis, the endoplasmic reticulum (ER) is a prominent example of subcellular RNA localization and local translation (Palade 1975; Blobel 1980, 2000; Walter et al. 1984; Johnson and van Waes 1999; Rapoport 2007; Reid and Nicchitta 2015). With ∼35% of the protein-coding genome encoding secretory and membrane proteins, RNA localization to the ER is also a uniquely complex biological example of local translation (Jansen 2001; Martin and Ephrussi 2009; Blower 2013; Ryder and Lerit 2018). How this large cohort of mRNAs is localized to the ER remains, however, unresolved. Typically, RNA localization operates via a translation-independent, cis-encoded RNA localization signal mechanism, where translationally silenced mRNAs complex with RNA-binding proteins and molecular motors to undergo directed trafficking to discrete subcellular domains of the cell (Oleynikov and Singer 1998; Jansen 2001; Ben-Ari et al. 2010; Das et al. 2021). RNA localization to the ER, in contrast, is thought to occur via a translation-dependent mechanism, the signal recognition particle (SRP) pathway. In the SRP pathway, topogenic signals (e.g., signal sequences and transmembrane domains) are recognized by the SRP upon emergence from the ribosome; the SRP-bound mRNA/ribosome/nascent chain complex (RNC) is then localized to the ER via direct binding interactions with the SRP receptor (SR), a heterodimeric ER protein complex comprising an integral membrane subunit (SRB) and an SRP-binding subunit, (SRA) (Blobel 1980, 2000; Walter et al. 1984; Gilmore 1993; Rapoport 2008; Ataide et al. 2011; Akopian et al. 2013; Hwang Fu et al. 2019). Foundational in vitro reconstitution studies provided direct biochemical evidence for this model and demonstrated that mRNA/ribosome localization to the ER is selective for topogenic signal-encoding mRNAs, is translation-dependent, and requires SRP and the SR (Walter and Blobel 1981a,b; Walter et al. 1981; Gilmore et al. 1982a,b).
The biological significance of the SRP pathway was further elaborated with the discovery of SRP and SR homologs in yeast, eubacteria, and archaea (Poritz et al. 1990; Hann and Walter 1991; Ogg et al. 1992; Zwieb and Eichler 2002; Zwieb and Bhuiyan 2010). Molecular genetic analyses of SRP pathway function in yeast demonstrated, however, that loss of function mutations in SRP54 or SR yielded only transient disruptions of protein secretion and were accompanied by an adaptive response comprising ER expansion and reduced translation/growth rates (Ogg et al. 1992; Mutka and Walter 2001). Consistent with these reports, recent studies in yeast demonstrated that secretory protein mRNA/ribosome complexes were localized to the ER in an SRP-deficient/SRP72 degron model (Costa et al. 2018). These findings indicate that, at least in yeast, ribosome/nascent chain trafficking to the ER can operate via SRP pathway-independent mechanism(s), presumably via the Sec62/63/71/72 post-translational pathway (Itskanov and Park 2019; Weng et al. 2021). Whether ER-directed mRNA localization in mammalian cells is similarly tolerant to loss of SRP pathway function is unknown.
Further revealing of the complexities surrounding mechanisms of mRNA localization to the ER, studies of the ER-associated mRNA transcriptome of yeast, fly, and mammalian cells demonstrated that cytosolic protein-encoding mRNAs are both broadly represented and translated on the ER (Kopczynski et al. 1998; Reid and Nicchitta 2012; Reid and Nicchitta 2015; Chartron et al. 2016; Chen and Tanaka 2018). The SRP pathway may thus be one of multiple processes supporting the local translation of secretory and membrane protein-encoding mRNAs on the ER. Other potential contributors to RNA localization to the ER include ER-resident RNA and/or ribosome binding proteins, although insights into their contributions to ER-directed RNA localization await further study (Gerst 2008; Cui et al. 2012; Cui and Palazzo 2014; Reid and Nicchitta 2015; Hsu et al. 2018; Bethune et al. 2019; Hoffman et al. 2019; Bhadra et al. 2021).
Here, we examined the SRP pathway function in RNA localization to the ER of mammalian cells. Pathway disruption was achieved by CRISPR/Cas9 knockout (KO) of SRPRB, encoding the membrane anchoring subunit of the SR. Loss of SRPRB expression was accompanied by profound destabilization of the SR α subunit, SRA. To fully disable SR expression, siRNA silencing of SRA in SRB KO cells was performed, and loss of SRA and SRB expression orthogonally validated by quantitative proteomic analysis. Steady-state mRNA and ribosome ER partitioning patterns were unperturbed in SR-deficient cells. Newly exported mRNAs efficiently localized to the ER of SR KO cells and, intriguingly, under conditions of translation initiation inhibition the ER was the default destination for all newly exported mRNAs. These data demonstrate that mRNA localization to the ER can be uncoupled from the SRP pathway function and suggest that the ER represents a transitional sorting station for newly exported mRNAs.
RESULTS
SRB KO destabilizes SRA
The yeast SR comprises two subunits, SRP101, the homolog of SRA, and SRP102, the homolog of SRB, the ER integral membrane protein that anchors SRA to the ER membrane (Ogg et al. 1992, 1998). Molecular genetic disruption of SRP101 or SRP102 phenocopies genomic deletions of SRP genes, confirming that the SR is a suitable target for investigating SRP pathway function in mRNA localization (Ogg et al. 1992, 1998; Mutka and Walter 2001). Here, HeLa-Cas9 and 293T-Cas9 cells were transduced with lentiviral SRB-targeting sgRNAs constructs, cell clones screened for loss of SRB expression, and mutations in SRB verified by genomic sequencing. Three SRB KO clones (HeLa Cas9 SRB KO1, HeLa Cas9 SRB KO2, and 293T Cas9 SRB KO3), each with nonsense mutations upstream of the encoded GTP binding domain were selected for study, with HeLa Cas9 SRB KO2, containing a premature termination codon upstream of both the predicted transmembrane and GTP binding domains serving as the primary clone analyzed (Fig. 1A; Supplemental Fig. S1). RT-PCR analysis of SRB intron–exon boundaries confirmed that SRB pre-mRNA transcripts underwent identical splicing reactions in the parental and CRISPR-edited HeLa cell lines; no intron retention or exon skipping patterns were detected in the SRB KO clonal lines (Supplemental Fig. S2). Immunoblot analysis of SRB expression in HeLa and 293T SRB KO cells confirmed the loss of SRB expression in either the cytosol (C) or membrane (ER) compartments of detergent-fractionated cells (Fig. 1B; Lerner et al. 2003; Jagannathan et al. 2011; Child et al. 2021), a finding orthogonally validated by quantitative proteomic analysis of cytosolic, peripheral, and membrane protein expression in parental and SRB KO cells (see Fig. 4).
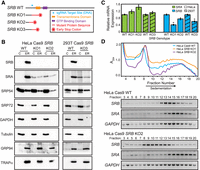
SRB KO destabilizes SRA and disrupts its localization. (A) Schematic representation of CRISPR/Cas9-directed mutations in SRB in HeLa Cas9 (KO1 and KO2) and 293T Cas9 (KO3) SRB KO clonal cell lines. See also Supplemental Figure S1. (B) Representative immunoblot analysis of expression levels and subcellular distributions ([C] cytosol, [ER] membrane fraction, inclusive of endoplasmic reticulum) of SR subunits (SRB and SRA), SRP subunits (SRP54 and SRP72), cytosolic proteins (GAPDH and β-tubulin) and ER-resident proteins (GRP94 and TRAPα) in HeLa and 293T SRB KO clones with paired parental cell line controls. (C) RT-qPCR analysis of SRA and SRB mRNA levels in three SRB KO clones and paired parental cells (WT). Expression levels were normalized to GAPDH with parental cell expression set to 1, n = 3 biological replicates. Data are means ± SD. (*) Indicates P-value ≤0.01. (D) Representative sucrose density gradient polysome profiles of HeLa Cas9 SRB KO2 and paired parental cell lines. See also Supplemental Figure S3. RNA was extracted from gradient fractions of the HeLa Cas9 WT and SRB KO2 cell lines, and semiquantitative RT-PCR was performed for SRB, SRA, and GAPDH mRNAs. PCR products were resolved by agarose gel electrophoresis. Data are representative of three biological replicates.
In marked contrast to prior findings in yeast, loss of SRB expression in HeLa cells was accompanied by a dramatic decrease in SRA levels (Fig. 1B; Ogg et al. 1998). As expected, and consistent with yeast, loss of SRB expression results in redistribution of the residual SRA to the cytosol (Ogg et al. 1998). Steady-state SRP levels and subcellular distributions, assayed by immunoblot for the SRP54 and SRP72 subunits or quantitative proteomics (see Fig. 4), were, however, not significantly altered in either the HeLa or 293T SRB KO cells, with SRP being predominately cytosolic (Fig. 1B).
The decrease in SRA protein levels observed in SRB KO HeLa and 293T cell lines could arise through a cooperative protein stability phenomenon, where loss of subunit expression destabilizes oligomeric partners, or through gene silencing. To distinguish between these scenarios, we first analyzed SRA transcript levels in SRB KO HeLa and 293T lines by RT-qPCR (Fig. 1C). SRA transcript levels in SRB KO cells were either indistinguishable from or slightly elevated relative to the parental lines, consistent with a cooperative protein stability mechanism as the primary mechanism for the reduction in SRA in SRB KO cells.
Notably, RT-qPCR analyses revealed that SRB transcript quantities in the different SRB KO clones were present at 50%–80% of the levels in the parental line (Fig. 1C), suggesting that the premature codon-bearing SRB mRNAs were substrates for nonsense-mediated decay (NMD). As NMD is translation-dependent and operates on ribosome-engaged mRNAs (Hu et al. 2010; Durand and Lykke-Andersen 2013; Kurosaki et al. 2019), we also examined mutant SRB mRNA translation by polysome profiling. Representative polysome traces for each SRB KO line and the paired parental controls are depicted in Figure 1D and Supplemental Figure S3. RNA was extracted from the gradient fractions and SRB, SRA, and GAPDH mRNA distributions determined by RT-PCR (Fig. 1D). While SRA and GAPDH mRNA profiles were similar in parental and SRB KO lines, mutant SRB mRNAs were shifted from the heavy polysome region (fractions 13–18) to predominately monosome and light polysome fractions (fractions 8–10), consistent with reports that NMD substrates are primarily in the 80S monosome and small polysome fractions (Hu et al. 2010; Heyer and Moore 2016).
Given the observed differences between the yeast and mammalian SR in apparent cooperative stability, we further examined the mechanism of SR cooperative stability. In these experiments, parental HeLa Cas9 WT, SRB KO1, and SRB KO2 cells were treated with the proteosome inhibitor MG132 for 16 h and SRA levels examined by immunoblot (Fig. 2A). Interestingly, and for both parental and SRB KO cell lines, MG132 addition enhanced SRA levels, indicating that it is a relatively unstable protein. In a second experimental approach, complementation studies were performed where SRB expression was restored in SRB KO cells via transient transfection with an SRB cDNA plasmid (Fig. 2B,C). In the HeLa Cas9 parental line, SRB overexpression did not substantially enhance SRA levels or alter subcellular distributions, with all SRA recovered in the ER compartment of detergent-fractionated cells (Fig. 2B). Overexpression of SRB in SRB KO cell lines resulted in redistribution of SRA to the ER and increased SRA levels (Fig. 2C). Combined, the above data demonstrate that KO of SRB disables SR heterodimer expression.
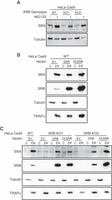
Cooperative stability interactions modulate SRP receptor subunit levels. (A) Representative immunoblot analysis of whole-cell lysates collected from HeLa Cas9 WT, SRB KO1, and SRB KO2 clonal cell lines following 16 h treatment with the proteasome inhibitor, MG132, or DMSO control. (B) Representative immunoblot analysis of subcellular distributions ([C] cytosol extract, [ER] membrane fraction, inclusive of endoplasmic reticulum) of SR subunits (SRA and SRB), SRP subunit (SRP54), cytosolic protein (β-tubulin), and ER-resident protein (TRAPα) in HeLa Cas9 WT cells transfected with empty vector or SRB expression vector at 0.2 µg/mL or 0.4 µg/mL (2×). (C) as in (B), HeLa Cas9 WT cells transfected with empty vector and SRB KO1 and KO2 clones transfected with empty vector or SRB expression vector at two concentrations.
Cell viability in the absence of SRP receptor expression
In yeast, loss of SRB expression and consequent relocalization of SRA to the cytosol does not compromise secretory and membrane protein biogenesis (Ogg et al. 1998). However, and as in yeast, SRA weakly associates with the ER membrane in the absence of SRB and presumably supports SRP pathway activity (Fig. 1B; Ogg et al. 1998). Similarly, prior in vitro reconstitution studies demonstrated that a proteolytic fragment of SRA restored mRNA localization/protein translocation activity to protease-inactivated rough microsomes (Gilmore et al. 1982a,b; Nicchitta and Blobel 1989). We thus considered that although the KO of SRB is accompanied by destabilization and redistribution of SRA, low levels of ER or cytosolic SRA could be sufficient for SRP pathway function. We therefore sought to block SRA expression via siRNA-mediated silencing in an SRB KO background. In SRB KO cells, SRA levels were near the threshold of immunoblot detection and so to accurately assess SRA half-life, protein knockdown time course studies were performed in HeLa Cas9 WT cells (Fig. 3A,B). SRA protein levels were substantially (∼90%) decreased by 72 h post-siRNA transfection and undetectable by 96 h (Fig. 3A). SRA mRNA levels were, however, maximally reduced at 24 h post-transfection indicating that in the presence of SRB, SRA has a half-life of ∼24 h (Fig. 3B).
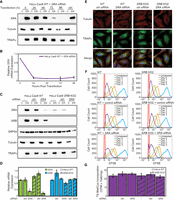
Cell viability and morphology are maintained in the absence of SR expression. (A) Representative time course of siRNA-mediated SRA knockdown in HeLa Cas9 WT cells assessed via immunoblot for SRA (target), β-tubulin (cytosolic control), and TRAPα (ER membrane control) after fractionation of cells into the cytosol (C) and ER compartments. Nontargeting siRNA control = ctrl. (B) As in (A), analysis of SRA mRNA levels by RT-qPCR from total RNA extracts. Data represent expression levels relative to 0 h and were normalized to GAPDH. n = 2 biological replicates. Data are means ± SD. (C) Representative immunoblot analysis of subcellular distributions ([C] cytosol, [ER] endoplasmic reticulum) of SR subunits (SRA and SRB), SRP subunit (SRP54), cytosolic protein (β-tubulin), and ER-resident protein (TRAPα) in HeLa Cas9 WT and SRB KO2 cells nontransfected (−) or transfected with nontargeting (ctrl) or SRA siRNA, 96 h post-transfection. (D) RT-qPCR analysis of SRA and SRB mRNA levels for experimental conditions in (C). Nontransfected wild-type expression levels were set as 1 after normalization to GAPDH. n = 3 biological replicates. Data are means ± SD. (*) Indicates P-value ≤0.01. (E) Representative immunofluorescence micrographs depicting β-tubulin (red) and TRAPα (ER marker) (green) for HeLa Cas9 WT and SRB KO2 cells transfected with either nontargeting (ctrl) or SRA siRNA, assayed 96 h post-transfection. DAPI nuclear stain is included in merged images (blue). Scale bar, 20 µm. (F) CFSE analysis of cell doubling rates assessed by flow cytometry over 3 d of cell culturing for cell conditions as in (C). Data are representative of three biological replicates. (G) [35S] methionine/cysteine incorporation over a 7.5 min labeling period for cell conditions as in (C). Data are presented as mean ± SD for three biological replicates.
Using the 96 h post-transfection time point, we validated SRA knockdown in a HeLa SRB KO background. Nontransfected and nontargeting siRNA controls confirmed destabilization of SRA protein and redistribution to the cytosol in the SRB KO cells (Fig. 3C). Knockdown of SRA in the SRB KO background reduced SRA levels to below detection limits by immunoblot and quantitative mass spectrometry analysis (Figs. 3C, 4F), yielding SR KO cells. Interestingly, loss of SRA expression in HeLa Cas9 parental cells was accompanied by substantial reductions in SRB, consistent with a reciprocal cooperative stability mechanism noted above (Fig. 3C). This conclusion was further supported by qPCR analyses demonstrating that knockdown of SRA did not significantly alter SRB mRNA levels, though SRB protein levels were reduced (Fig. 3C,D). As observed in SRB KO cells (Fig. 1B) and following SRA knockdown (O'Keefe et al. 2021), SRP54 expression and membrane-association in SR KO cells were very similar to the parental line.
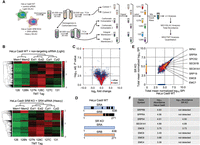
SILAC/TMT analysis of proteome expression in HeLa Cas9 and SR KO cells. (A) Schematic representation of combined SILAC/TMT multiplexed proteomic analysis. HeLa Cas9 WT and SRB KO2 cells were cultured in light and heavy amino acid culture media, respectively, for 7 d. On day 3, parental and SRB KO2 cells were transfected with nontargeting or SRA siRNA, respectively. Ninety-six hours post-transfection, equal numbers of light and heavy amino acid labeled cells were combined and homogenized. Homogenates were then centrifuged to separate the microsome/membrane pellet from the cytosol fraction. Membrane pellets were rehomogenized in carbonate/urea buffer and centrifuged to separate the integral membrane and peripheral membrane protein fractions. Biological replicate fractionation experiments were performed, fractions processed, subject to isobaric labeling (tandem mass tag, TMT), combined, and analyzed by LC–MS/MS. (B) Heat map plots illustrating compositions, reproducibility, and efficacy of cell fractionation protocol. Hierarchical clustering performed with scaling prior to clustering. (Mem) Membrane fraction, (Ext) urea/carbonate extractable membrane fraction, (Cyt) supernatant fraction after separation of membrane and membrane-associated proteins. (C) Volcano plot depicting log2-fold scaled protein distributions, comparing heavy and light amino acid labeled samples collected as in (A). (D) Schematic illustration of peptide coverage for SRA and SRB in HeLa Cas9 WT and SR KO cells, derived from TMT quantitation data sets. (E) Comparison of calculated protein abundances (spectral peptide index, SPI) determined as in (A), see also Materials and Methods, for proteins detected in the membrane fraction of HeLa Cas9 WT cells transfected with nontargeting siRNA and HeLa Cas9 SRB KO2 cells transfected with SRA siRNA, as described in (A). (Red) Integral membrane protein; (blue) other, nonmembrane protein; (yellow) ER resident integral membrane protein. A subset of ER-resident membrane protein distributions is indicated, as is the SRP54 subunit of SRP. (F) Table of relative log10 abundances of a subset of ER-resident membrane proteins, illustrating down-regulation of EMC4,9,6, and SRB/SRA subunits. See also Supplemental Data S1.
In yeast, SRP pathway inactivation reduces cell growth and translation rates (Ogg et al. 1998; Mutka and Walter 2001). Surprisingly, cell morphology (Fig. 3E; Supplemental Fig. S4A), cell division (Fig. 3F; Supplemental Fig. S4B), and [35S] Met/Cys incorporation rates (Fig. 3G; Supplemental Fig. S4C) were unaffected by loss of SR and/or SRB expression in HeLa or 293T cells, demonstrating that over the time periods studied, SR is not essential for tissue culture cell viability.
Proteomic analysis of SR function in membrane protein biogenesis
Prior studies of the translation elongation arrest function of SRP reported that SR levels are rate-limiting for protein translocation in the ER in vivo, with SR knockdown disrupting membrane protein biogenesis and protein secretion (Lakkaraju et al. 2008). siRNA knockdown of SRA was also reported to substantially inhibit Type III membrane protein biogenesis (O'Keefe et al. 2021). We thus hypothesized that although mammalian tissue culture cells are tolerant of SR KO, loss of SR expression would disrupt protein biogenesis at the ER. To examine SR function in membrane protein biogenesis a TMT-SILAC (tandem mass tag and stable isotope labeling by amino acids in cell culture) quantitative proteomic study was performed, comparing the proteomes of HeLa Cas9 parental cells transfected with nontargeting siRNA (HeLa control) with HeLa SRB KO cells transfected with SRA siRNA (=SR KO) 96 h post-transfection. To enhance the detection of integral membrane proteins, which are generally under-represented in whole-cell proteomic analyses (Alfonso-Garrido et al. 2015; Kongpracha et al. 2022), light (HeLa Cas9) and heavy (HeLa SR KO) stable isotope-labeled cells were combined, Dounce homogenized, and separated into cytosol and total membrane protein fractions by ultracentrifugation. The membrane pellet was then homogenized in a sodium carbonate/urea buffer and recentrifuged to yield lumenal/peripheral protein (carbonate/urea-extractable) and integral membrane protein (carbonate/urea-inextractable) fractions (Fig. 4A; Fujiki et al. 1982). Immunoblot analysis for cytosolic (tubulin), ER lumen (GRP94), and ER membrane (TRAPα) proteins confirmed the efficacy of the fractionation procedure (Supplemental Fig. S5). A heat map representation and hierarchical clustering analysis of the quantitative (TMT) proteomic data sets illustrate the similarities in the protein compositions of the biological replicates as well the distinct protein compositions of the different cellular subfractions for both SILAC channels, a conclusion that was confirmed by principal component analysis (Supplemental Fig. S6). Also evident in the heat map plots are the broad similarities in the protein compositions of the HeLa Cas9 and HeLa SR KO cells (Fig. 4B). GO:cellular component analyses quantify these similarities and demonstrate that protein compositions and subcellular enrichments of the HeLa Cas9 and HeLa SR KO cell proteomes were similar, though not identical (Supplemental Fig. S7). The high similarities between the protein compositions of the HeLa Cas9 and HeLa SR KO cells are further illustrated in a Venn plot of protein IDs in the two cell genotypes (Supplemental Fig. S8).
A volcano plot of mean normalized TMT intensities versus FDR-adjusted P-values, where the membrane proteins are indicated in red and all other proteins in blue, revealed modest differences in membrane protein expression in the HeLa Cas9 parental versus HeLa SR KO cells, with similar numbers of membrane proteins either up- or down-regulated (Fig. 4C). Critically, high confidence SRA- and SRB-derived peptides were identified in HeLa-Cas9 parental cells but were absent or below detection limits in the SR-KO cells (Fig. 4D). These latter data provide orthogonal validation of the SR KO phenotype (Fig. 3A,C). Given the expected phenotypes of disrupted membrane protein biogenesis in SR-deficient cells (Keenan et al. 2001; Akopian et al. 2013), we focused our analysis on the membrane proteome compositions of HeLa Cas9 and SR KO cell lines, examining both single transmembrane and polytopic membrane protein compositions (Fig. 4E). Intriguingly, membrane protein biogenesis was only modestly affected by loss of SRP pathway activity, with most membrane proteins identified in both cell types and at similar expression levels. Of the 287 polytopic membrane proteins identified, ∼25% were found to be down-regulated, and of the 350 single transmembrane proteins identified, ∼20% were down-regulated. Notably, loss of SR expression did not affect SRP composition or expression, where SRP9, SRP14, SRP19, SRP54, SRP68, and SRP72 were identified in both the light and heavy isotope channels, nor did it significantly alter the expression of the Sec61 translocon or the TRAP (SSR) complex (Fig. 4F; Supplemental Data S1). Loss of SR expression was, however, accompanied by a substantial reduction of the SPCS1 subunit of the signal peptidase complex, the OSTC subunit of the STT3A-containing oligosaccharyltransferase, and as displayed in Figure 4F, the endoplasmic reticulum membrane protein complex (EMC) subunits EMC4, 6, and 9. Whereas SPCS1 and OSTC are considered dispensable for SPC and OST function, respectively, the phenotypic consequences of EMC4,6,9 down-regulation are unclear and it is not known whether down-regulation of these subunits may compensate for loss of SR expression. The question of why loss of SR expression is accompanied by alterations in EMC composition requires further study. Secretory pathway machinery was unaffected by loss of SR expression, with no significant changes in expression of the Sec gene products Sec13, Sec22B, Sec23A–B, Sec24A–D, Sec31, Sec62, or Sec63 observed in SR KO cells (Supplemental Data S1). In summary, although the loss of SR expression was accompanied by modest changes in the cellular proteome, no pan-cohort (e.g., secretory, integral membrane) disruption in protein biogenesis was observed, indicating that protein targeting and translocation at the ER was operational in the absence of SR.
The findings presented above prompt the question of how in a cotranslational, SRP pathway model, secretory and membrane protein-encoding mRNAs are appropriately localized to the ER in the absence of SR expression. Relating to this question, disabling SRP function in yeast by an SRP72 auxin-degron approach was accompanied by a rapid increase in mitochondrial fragmentation, a finding attributed to the cotranslational mistargeting of nascent secretory/membrane proteins to the mitochondria (Costa et al. 2018). To determine if loss of SRP pathway function induced mitochondrial fragmentation in mammalian cells, mitochondrial morphology and unit areas were examined by transmission electron microscopy, comparing HeLa Cas9 and HeLa SR KO cells. As summarized in Supplemental Figure S9A,B, mitochondrial surface areas and morphologies were very similar between the parental and SR-KO HeLa cells, with no apparent ultrastructural evidence of mitochondrial fragmentation or statistically significant differences in quantified surface areas. Whether the differences between these and prior results reflect different sensitivities in yeast and mammalian cells to SRP pathway inactivation and/or distinct physiological responses to rapid (degron-mediated) versus gene-editing/clonal selection-based experimental models will require further study.
Steady-state mRNA and ribosome trafficking in SRP receptor KO cells
To determine the consequences of loss of SR expression on mRNA and ribosome trafficking to the ER, we first examined steady-state mRNA composition and fractional enrichments in the cytosol and ER compartments. The two subcellular fractions were isolated from HeLa Cas9 and HeLa SR KO cells by sequential detergent extraction and the mRNA populations analyzed by deep sequencing (Supplemental Data S2; Supplemental Fig. S10). Analyses of mRNA enrichments on the ER revealed similar mRNA partitioning between the two genotypes with >90% of mRNAs showing log2FC < 1 in their relative ER enrichment (Fig. 5A). The loss of SR expression was also not accompanied by large-scale transcriptional responses, with >90% of genes displaying less than twofold differences in expression between the HeLa Cas9 and SR-KO cells (Fig. 5C). Of particular interest, no mRNA cohort-specific changes in fractional ER enrichments were observed in the absence of SR, where cytosolic-, secretory-, single transmembrane domain-, and polytopic protein-encoding mRNA distributions were assessed (Fig. 5B). In examining those genes displaying statistically significant up- or down-regulation in the SR KO background, there was no apparent link to the encoded protein subtype (e.g., secretory or membrane) as would be expected if SR served an essential function in the localization of topogenic signal-encoding mRNAs to the ER (Fig. 5D).
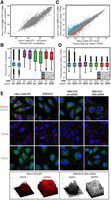
RNA-seq and single-molecule FISH analysis of mRNA ER partitioning, abundance, and subcellular localization in HeLa Cas9 and SR KO cells. (A) Poly(A) mRNA fractional ER enrichments in HeLa Cas9 WT cells transfected with nontargeting siRNA versus HeLa Cas9 SRB KO2 cells transfected with SRA siRNA, 96 h post-transfection. Log2FC ≥ 1 is colored in blue for up-regulated, red in down-regulated. (B) Box/whisker plot depicting ER localization of mRNAs encoding cytosolic, secretory, single transmembrane (single-TM), and polytopic membrane (multi-TM) protein-encoding mRNAs in SR KO and control cell lines as in (A). (C) As in (A), but for total mRNA expression levels. (D) As in (B), but for total mRNA expression. See also Supplemental Data S2. (E) Representative single-molecule FISH (smFISH) imaging of subcellular mRNA distributions in HeLa Cas9, SRB KO HeLa (SRB KO), SRB KO transfected with nontargeting siRNA (SRB KO + nt siRNA), and SRB KO transfected with SRA-targeting siRNA. smFISH studies were performed for the cytosol-enriched mRNA GAPDH (green) and the ER-enriched mRNAs, GRP94 (red), GRP78 (red), and CD147 (red). Immunofluorescence staining of the ER-resident membrane protein TRAPα identifies the ER profile. Cell outlines were mapped from paired DIC images. Scale bar, 20 µm.
To orthogonally validate the subcellular mRNA localization patterns determined by biochemical cell fractionation/RNA-seq, single-molecule RNA imaging (smFISH) studies were performed, examining GAPDH, a cytosol-enriched mRNA, and the ER-targeted mRNAs GRP94, which encodes a canonical signal sequence, and CD147, encoding an integral membrane protein (Fig. 5E). A paired comparison of GAPDH and GRP94 mRNA localization patterns in HeLa Cas9, Hela SRB KO, HeLa SRB KO + nontargeting siRNA, and HeLa SRB KO + SRA-targeting siRNA cells illustrates the perinuclear enrichment pattern characteristic of ER-localized mRNAs (GRP94), which is distinct from a cytosol-enriched mRNA (GAPDH) (Jagannathan et al. 2014; Child et al. 2021). Paired ER membrane profiles obtained by immunofluorescent staining for the ER membrane protein TRAPα are also depicted. Consistent with the biochemical fractionation/RNA-seq data in Figure 5A–D, loss of SR expression did not discernably alter the subcellular distribution patterns of either GAPDH, GRP94, or CD147 mRNAs, a conclusion further substantiated by histogram intensity plots of GAPDH and GRP94 smFISH fluorescence distributions (Fig. 5E). These data further support the conclusion that mRNA localization to the ER can operate at high fidelity when SRP pathway function is compromised.
In yeast, loss of SRP pathway function is accompanied by an adaptive transcriptional response (Ogg et al. 1992, 1998; Mutka and Walter 2001). To screen for candidate transcriptional adaptations to loss of SR expression in the SR KO HeLa cells, differential expression analyses were performed (Supplemental Fig. S11A–D). Volcano plot analysis revealed relatively small but significant differences in gene expression in both SRB KO (4.6% of total gene count; log2FC ≥ 1) and SR KO (7.6% of total gene count; log2FC ≥ 1) cells, as compared to parental HeLa Cas9. Panther classification GO analysis for gene set enrichments was performed to identify candidate adaptive transcriptional responses. Notably, comparisons of the transcriptional response to loss/reduction of SRB, SRA, and the combined SRB/SRA KO yielded similar GO category enrichment patterns (Supplemental Figs. S12, S13). In the Biological Process subontology, the two most enriched GO terms were cellular process (GO: 0009987) and biological regulation (GO: 0065007) (Supplemental Fig. S12). Analysis in GO subontology Molecular Function revealed significant enrichment in the GO terms binding (GO: 0005488) and catalytic activity (GO:0003824) (Supplemental Fig. S13). The similar primary GO gene enrichment categories returned for the SRB KO, SRA KD, or the combined SRB KO/SRA KD conditions are consistent with the biochemical data (Fig. 2), demonstrating cooperative stability interactions between the two gene products, and are consistent with a general conclusion that disruption of SRP pathway function impacts cell function and physiology though ER-directed RNA localization and general protein biogenesis patterns in the SR KO and WT cells are similar. The transcriptional response to loss of SR expression in mammalian cells was thus distinct from that reported in yeast, where heat shock gene induction and repression of protein synthesis genes, as well as reductions in steady-state protein synthesis rates, are hallmark responses to SRP pathway disruption (Mutka and Walter 2001). As will be later discussed, these analyses raise the interesting question of whether the transcriptional response to CRISPR inactivation of SRB expression in mammalian cells is adaptive and yields expression or up-regulation of homologous compensating genes, or alternatively is a response to an altered cell physiological state of the gene-edited cell lines and unrelated to transcriptional regulation of putative compensating gene(s) (Sztal and Stainier 2020). In one experimental approach to this question, we examined the effects of acute loss of SRA/SRB expression on signal sequence-encoding mRNA localization to the ER using a double siRNA knockdown strategy. In these experiments, HeLa Cas9 cells were transfected with pooled SRA/SRB siRNAs and at 96 h, where reductions in protein expression are maximal (Fig. 3A,B) cells were fractionated by sequential detergent extraction and the mRNA compositions of the cyotoslic and ER-associated total RNA pools evaluated by qRT-PCR. Three ER-targeted mRNAs were examined; GRP94, GRP78, and B2M. As shown in Supplemental Figure S14, steady-state ER enrichment levels for the three ER-targeted mRNAs were very similar if not identical in control (HeLa Cas9) and HeLa Cas9 SRA/SRB knockdown cells. The similarities in mRNA localization patterns between the acute (siRNA) and chronic (CRISPR-editing) gene silencing approaches favor the view that mRNA localization to the ER can operate efficiently in the absence of SRP pathway function.
The steady-state ribosome distribution between the cytosol and the ER of HeLa Cas9 parental and SRβ KO cell lines with and without SRα knockdown was also examined. Here, ribosome and tRNA distributions between the cytosol and ER were similar under all experimental conditions examined, indicating that ribosome partitioning to the ER is not obligatorily SR-dependent (Supplemental Fig. S15).
SR-independent trafficking of newly exported mRNAs and ribosomal subunits to the ER
With prior work identifying SR as rate-limiting in protein trafficking to the ER (Lakkaraju et al. 2008), we considered that SR may function as a fidelity/rate enhancer in mRNA localization to the ER. In this scenario, a role for SR in mRNA localization to the ER could be masked by a dominant contribution of pre-existing, ER-localized mRNAs. To test this hypothesis, 4-thiouridine (4SU) transcriptional pulse-chase was performed to examine the localization kinetics of newly exported RNAs (Woodford et al. 1988; Duffy et al. 2019). HeLa Cas9 parental and SR-deficient cell cultures were supplemented with 4SU for 15 min (transcriptional pulse) and a 4SU labeling chase initiated by exchanging the cells into uridine-supplemented media. At the indicated chase time points, cells were fractionated into the cytosol and ER compartments and total RNA isolated. To validate that the fractionation procedure efficiently separated ER (membrane)-associated and nuclear RNAs, cell fractions were examined for enrichments of the nuclear lncRNAs NEAT and MALAT1, the cytosolic/nuclear lncRNA NORAD, the cytoplasm-enriched mRNA GAPDH, and the ER-enriched mRNA GRP94. As shown in Supplemental Figure S16, the fractionation procedure efficiently separated nuclear, ER-associated, and cytoplasmic RNAs. The 4SU-labeled RNA fraction was subjected to thiol-specific biotinylation and either separated by agarose gel electrophoresis to assess ribosomal subunit localization (4SU-18S and 28S rRNAs) (Fig. 6A–C) or enriched for the 4SU-poly(A) mRNA fraction by oligo(dT) selection and this fraction deep sequenced (Fig. 6D–G; Supplemental Data S3). The kinetics of ribosomal subunit export and subcellular localization are illustrated in Figure 6A,B, with the data in Figure 6A depicting steady-state (methylene-blue stained) large (28S) and small (18S) ribosomal subunit distributions and the trafficking patterns of newly synthesized and exported 4SU-labeled small and large ribosomal subunits shown in Figure 6B,C. 4SU-labeled small and large ribosomal subunits were detected at the 1.5 h chase point, with levels increasing to the 6 h chase point (Fig. 6B,C). As illustrated in Figure 6C, the kinetics of small and large ribosomal subunit appearance and distribution between cytosol and ER fractions were similar in the presence or absence of SR expression over a 6 h time course (Fig. 6C). These data demonstrate that the trafficking of newly exported ribosomal subunits/ribosomes to the ER is not dependent upon SR expression.

Newly exported ribosomes and mRNAs localize to the ER in the absence of SR expression. (A,B) Representative time course of ribosomal subunit synthesis, nuclear export, and trafficking between the cytosol and ER. HeLa Cas9 WT cells transfected with nontargeting siRNA and HeLa Cas9 SRB KO2 cells transfected with SRA siRNA were pulse-labeled with 4SU 96 h post-transfection for 15 min and chased with excess uridine for the indicated time points. Cells were fractionated into cytosol and ER fractions, RNA was extracted, 4SU-RNA biotinylated, and RNA fractions were separated by denaturing agarose gel electrophoresis. Total RNA was detected by methylene blue (A) and 4SU-labeled RNA was detected by streptavidin-IRDye 800 imaging (B) of the same transfer membrane. (C) Quantitation of 4U 28S and 18S rRNA bands from (B). Data are averages of band intensity from two biological replicate RNA gels ± SD. (D) Time course of 4SU-poly(A) mRNA accumulation in the cytosol and ER fractions in HeLa cells, with the total representing the sum of the two fractions. (E) Fractional enrichments of newly exported, 4SU-poly(A) cytoplasmic, secretory, single transmembrane (single-TM), and polytopic membrane (multi-TM) protein-encoding mRNAs in the ER fraction. (F) As in (E), with cells treated with harringtonine at the start of the 4SU pulse-labeling period. (G) Comparison of 4SU-poly(A) mRNA enrichments for cytoplasmic, secretory, single transmembrane (single-TM), and polytopic membrane (multi-TM) protein-encoding mRNAs between HeLa Cas9 WT cells transfected with nontargeting siRNA and HeLa Cas9 SRB cells transfected with SRA siRNA 96 h post-transfection.
To examine the trafficking itineraries of newly exported poly(A) mRNAs, 4SU-seq analyses were performed on samples collected at 15 min intervals over a 60 min time course (Fig. 6D). Summation of total 4SU-seq mappable reads across the 1 h chase time course revealed approximately linear mRNA export rates as well as an enrichment of 4SU-poly(A) mRNA in the ER versus cytosol fractions (Fig. 6D; Supplemental Fig. S17). Using the 45 min chase point as representative, the composition and subcellular distributions of newly exported 4SU mRNAs were determined (Fig. 6E). These analyses revealed the expected high enrichment of signal-encoding mRNAs on the ER as well as a substantial presence (∼0.4–0.6 fractional enrichment) of cytosolic/nucleoplasmic protein-encoding mRNAs in the ER fraction (Fig. 6E; Supplemental Fig. S17). Previous studies have identified a broad steady-state representation of cytosolic/nucleoplasmic protein-encoding mRNAs on the ER of mammalian cells (∼0.2 fractional enrichment) as well as yeast and fly (Kopczynski et al. 1998; Diehn et al. 2000, 2006; Chen et al. 2011; Reid and Nicchitta 2012, 2015; Jan et al. 2014). The data obtained here by 4SU pulse-chase analysis mirror these findings and suggest that this phenomenon is also evident in the population of newly exported and localized mRNAs.
To determine if the ER localization of newly exported mRNAs was translation-dependent, we examined mRNA export and trafficking in the presence of harringtonine, a selective inhibitor of translation initiation (Huang 1975; Ingolia et al. 2012). As depicted in Figure 6F and Supplemental Figure S17, the trafficking of newly exported signal-encoding mRNAs to the ER was not altered by harringtonine treatment. Surprisingly, inhibition of translation initiation dramatically altered the subcellular trafficking patterns of newly exported cytosolic protein-encoding mRNAs, with newly exported cytosolic protein mRNAs being recovered entirely from the membrane fraction, suggesting that for this cohort of mRNAs, nuclear export is coupled to a translation-dependent process of cytoplasmic localization (Fig. 6F; Supplemental Fig. S17).
To directly address SRP pathway function in ER-directed mRNA localization, identical experiments were performed to compare the relative ER enrichments of newly exported 4SU-poly(A) mRNAs in HeLa control and SR-deficient cells. As shown in Figure 6G, the relative ER enrichments of 4SU mRNAs encoding cytosolic, secretory, single transmembrane, and multitransmembrane domain proteins were quite similar between HeLa Cas9 control and SR-deficient cells, though at the population level ER enrichment levels were modestly though discernibly reduced in the SR-deficient cells. Combined with the translation inhibition study described above, these data demonstrate that neither translation nor SR are obligatory for the dynamic localization of topogenic signal-encoding mRNAs to the ER (Fig. 6E,F). The unexpected finding that newly exported mRNAs are predominately localized to the ER points to this compartment as a potential staging center for subcellular mRNA trafficking.
DISCUSSION
Using CRISPR/Cas9 gene KO and siRNA silencing approaches, we report that localization of topogenic signal-encoding mRNAs to the ER of HeLa and HEK293 cells is independent of SR expression. With SR thought to serve an essential role in the cotranslational targeting of mRNAs to the ER, a view well supported by in vitro reconstitution studies, these findings demonstrate that in mammalian tissue culture cells, SRP pathway function in RNA localization to the ER can be uncoupled from its established roles in protein translocation. These observations reopen investigation into the long-standing and enigmatic questions regarding the mechanism of topogenic signal-encoding mRNA localization to the ER (Palade 1975; Blobel 2000; Nicchitta et al. 2005; Gerst 2008; Cui and Palazzo 2014; Reid and Nicchitta 2015).
The data reported here do not support an essential role for the SR function in RNA localization to the ER of mammalian cells. Yet, the evolutionary conservation of the SRP pathway in eubacteria, archaea, and eukaryotes is strong testimony to its biological importance, perhaps to functional elements of organelle-compartmentalized proteome expression that remain to be fully appreciated. Consistent with this view, it was recently suggested that in yeast, the SRP pathway may primarily serve as a fidelity enhancer, operating to prevent protein mis-localization to the mitochondria, rather than directing RNA localization to the ER per se (Costa et al. 2018). In contrast to prior studies in yeast though, no apparent defects in mitochondrial morphology or average surface area were observed in the HeLa SRB KO/SRA KD experimental model. The regulatory interplay between the nascent polypeptide-associated complex (NAC) and SRP may be also relevant to such a fidelity-enhancing function (Wang et al. 1995; Möller et al. 1998; Wiedmann and Prehn 1999). Recent biophysical reconstitution studies demonstrating that NAC enhances the specificity of ribosome/nascent chain/SRP interactions with SR further support this view (Hsieh et al. 2020). Whether this functionality also reflects a role in RNA localization to the ER remains to be determined, though such a function has been suggested in Caenorhabditis elegans (Gamerdinger et al. 2015).
In evaluating the data obtained in the CRISPR-edited tissue culture cell models used here, we noted that CRISPR inactivation of SRB expression in mammalian cells was accompanied by a transcriptional response distinct from that reported in yeast SRP pathway gene KO or temperature-sensitive mutant allele expression studies (Ogg et al. 1992, 1998; Mutka and Walter 2001). In addition to the challenge in strictly comparing lower eukaryote and metazoan transcriptional outputs, the dissimilarities in the transcriptional responses may also reflect the experimental methods for gene disruption. Specifically, the CRISPR-editing approach used here does not inactivate gene expression as in the yeast experiments, rather it yields expression of mutant, premature codon-bearing transcripts (Fig. 1A; Supplemental Fig. S1). In this scenario, the transcriptional response may in part reflect the recently discovered transcriptional adaptation phenomenon where premature codon-bearing mutant transcripts from CRISPR-edited alleles induce the expression of homologous, compensating genes (Rossi et al. 2015; Sztal and Stainier 2020). No protein-encoding gene(s) homologous to or likely compensating to SRB have, however, yet been identified and so it appears that the broader transcriptional response to the inactivation of SR expression may be more an indirect response to an altered physiological state of the gene-edited cell lines than a compensatory transcriptional adaptation. Also relevant to the question of transcriptional adaptation, a phenomenon discovered through analysis of phenotypic discrepancies between CRISPR-engineered KO and siRNA or morpholino-based gene knockdown approaches, we examined ER-directed RNA localization in the parental HeLa Cas9 cells subjected to SRA/SRB knock down by pooled siRNA transfection (El-Brolosy et al. 2019; Ma et al. 2019; Sztal and Stainier 2020). Here, too, signal sequence-encoding mRNAs were accurately localized to the ER, further suggesting that loss of SR expression does not induce the expression of homologous/compensating gene expression. GO analyses of the differentially expressed genes in SRB-edited as well as the SRB KO/SRA KD cells are consistent with this conclusion, where SRP pathway, ER targeting, or intracellular mRNA localization subontologies were not identified. Combined, these data indicate that the primary mechanism of RNA localization to the ER is independent of and autonomous from the SRP pathway function. In the absence of a molecular identification of such a pathway, however, this view remains conjecture.
Further work is needed to identify the mechanism of SRP pathway-independent RNA localization to the ER. Candidate pathways include ER-localized translation initiation, where de novo translation on ER-bound ribosomes would serve as an RNA localization mechanism (Jagannathan et al. 2014; Voigt et al. 2017; Hoffman et al. 2019), and the direct anchoring of mRNAs to the ER via ER-resident RNA-binding proteins, for example, p180 and AEG-1 (Gerst 2008; Cui et al. 2012; Cui and Palazzo 2014; Hsu et al. 2018; Bethune et al. 2019; Hoffman et al. 2019; Hannigan et al. 2020; Bhadra et al. 2021). In the latter scenario, ER-anchored mRNAs could recruit ribosomal subunits to support ER-localized translation and, in the case of secretory/membrane proteins, coupling of ER-bound ribosomes to the Sec61 translocon (Reid and Nicchitta 2015). How ER-resident RNA-binding proteins contribute to the localization of mRNAs on the ER remains an intriguing question, with growing evidence supporting a role for cis-encoded localization information in this process (Palazzo et al. 2007; Benoit Bouvrette et al. 2018; Ma and Mayr 2018; Cohen-Zontag et al. 2019; Arora et al. 2021; Ma et al. 2021). A recent study has provided substantial evidence for such a mechanism (Cheng et al. 2021). In this report, Cheng et al. (2021) performed a transcriptome-wide analysis of the translation dependence of mRNA association with the ER and report that the capacity for direct (e.g., translation-independent) mRNA association with the ER is widespread and is influenced by transcript length, sequence content, and propensity for secondary structure. Notably, 3′-UTR length was positively correlated with translation-independent ER association, a finding further validated in comparisons of cell differentiation-linked 3′-UTR lengthening. The recently identified TIS granule also provides an example of cis-encoded mRNA localization information, where membrane protein-encoding mRNAs with AU-rich 3′-UTR elements are recruited to ER-associated, TIS11B-enriched membraneless organelles, with recruitment enhancing encoded protein expression (Ma and Mayr 2018; Ma et al. 2021).
Once localized to the ER, mRNAs undergo cycles of initiation, elongation, and termination while in the ER-bound state. As these processes represent the supermajority of translation events on the ER, we considered that SRP pathway function in an initial or pioneer mRNA localization event might be masked by the relatively small contribution of newly exported mRNAs to the total mRNA population of the cell. This question prompted the development of an experimental approach to evaluating SRP pathway function in the ER localization of newly exported mRNAs. The findings reported here indicate that (i) newly exported secretory and membrane protein-encoding mRNAs are accurately localized to the ER in the absence of SR expression, and (ii) when translation initiation is suppressed by the addition of the translation initiation inhibitor harringtonine, the ER membrane serves as the default destination for newly exported mRNAs. How translation initiation is linked to the ER localization of newly exported mRNAs requires further study, including identification of the subcellular site(s) of translation initiation (Palade 1975; Jagannathan et al. 2014; Reid and Nicchitta 2015). An attractive possibility is that RNA localization to the ER occurs coincident with nuclear export, with subsequent protein biogenesis/translocation being under the regulatory influence of the SRP pathway. Insights into the mechanism(s) of RNA localization to the ER will thus likely be aided by a detailed understanding of the trafficking itineraries of newly exported mRNAs, the subcellular organization of export-coupled mRNA localization, and the contribution of free and ER-bound ribosomes to the pioneer rounds of translation that accompany mRNA export, RNA-binding protein remodeling, and NMD scanning (Mahadevan et al. 2013; He and Jacobson 2015; Kurosaki et al. 2019; Child et al. 2021).
MATERIALS AND METHODS
CRISPR/Cas9 knockout cell lines and allele-specific genome sequencing
HeLa and 293T cells were transduced with a Cas9-containing lentivirus encoding blasticidin resistance. Transduced cells were selected with 10 µg/mL blasticidin and tested for Cas9 editing efficiency using a positive control sgRNA. High-efficiency editing clones were selected by mutational screening using the Surveyor Mutational Detection Kit (IDT), and performed as described by the manufacturer. High-efficiency editing clones stably expressing Cas9 (HeLa Cas9 WT and 293T Cas9 WT) were expanded and transduced with lentivirus containing sgRNA against SR subunit β (SRB, AGCCCTACCTAGACACCTTG) and including puromycin resistance. Transduced cells were selected with 2 µg/mL puromycin and 10 µg/mL blasticidin to ensure sgRNA and Cas9 expression, respectively, and single-cell cloned. Clones were screened for mutations via the Surveyor Mutational Detection Kit (IDT) following amplification of the SRB genomic DNA region spanning the sgRNA target site, performed with Takara Hot Start DNA Polymerase (Takara Bio USA, Inc.) and the primers: 5′-TGTGTGTCCCTCGACAAATAAC-3′ (forward), 5′-AGTTGGTGTCAAGACCCTGAGT-3′ (reverse). Clones showing mismatch mutations were screened for SRB protein expression via immunoblot, as described below. Clones without detectable SRB protein expression were selected and genomic SRB PCR products sequenced following Zero Blunt TOPO cloning (Thermo Fisher). Bacterial colonies were screened until each independent sequence was identified at least three times for all SRB KO clonal cell lines, to ensure all alleles were detected. Nonsense mutations in the mutated alleles were confirmed by reading the frame analysis of sequenced PCR products using Expasy Translate (Swiss Institute of Bioinformatics). HeLa and 293T clones with mutations were detected by Surveyor Mutational Detection, and lacking protein expression via immunoblot, and with nonsense mutations in all detected alleles, were then expanded (HeLa Cas9 SRB KO1, HeLa Cas9 SRB KO2, and 293T Cas9 SRB KO3).
Sequential detergent fractionation
All samples and reagents were RNase-free and kept on ice unless otherwise specified. Cell monolayers were washed twice with PBS, recovered by scraping, incubated on ice for 10 min to depolymerize the microtubule network, and pelleted by centrifugation (2500 rpm, 4°C, 5 min). Cell pellets were resuspended in ice-cold digitonin cytosol extraction buffer (0.03% digitonin, 110 mM KCl, 25 mM HEPES, pH 7.2, 15 mM MgOAc2, 4 mM CaCl2, 1× Roche cOmplete protease inhibitor, 40 U RNaseOut) and incubated on ice for 10 min. Samples were centrifuged at 6000 rpm, 5 min, 4°C to recover the cytosol-extracted permeabilized cells. Supernatants were collected as cytosol fractions and the permeabilized cell pellets were suspended in 100 µL digitonin wash buffer (0.0015% digitonin, 110 mM KCl, 25 mM HEPES, pH 7.2, 15 mM MgOAc2, 4 mM CaCl2, 1× Roche cOmplete protease inhibitor, 40 U RNaseOut). Samples were centrifuged (6000 rpm, 5 min, 4°C) to pellet the cytosol-extracted cells. Supernatant fractions were combined as the cytosol fraction and membrane pellets were resuspended in ice-cold n-dodecylmaltoside (DDM) solubilization buffer (2% DDM, 200 mM KCl, 25 mM HEPES, pH 7.4, 15 mM MgOAc2, 4 mM CaCl2, 1× Roche cOmplete protease inhibitor, 40 U RNaseOut) and incubated on ice for 10 min. Samples were centrifuged (12,000 rpm, 5 min, 4°C) to clear the samples of nuclei and cell debris. Supernatants were collected as membrane (ER) fractions. Cytosol and ER fractions were processed for protein precipitation or RNA extraction, as described below.
Protein precipitation
Following sequential detergent fractionation or whole-cell lysis with RIPA buffer for 10 min on ice, TCA was added to fractions or lysates to a final concentration of 10% wt/vol. Samples were incubated on ice at 4°C and centrifuged (14,000 rpm, 10 min, 4°C) to pellet TCA-precipitated protein. Supernatants were aspirated and protein pellets washed twice in ice-cold 100% acetone. Washed TCA pellets were dried for 10 min at 95°C and stored at −20°C.
Immunoblotting
TCA-precipitated protein pellets were resuspended in 0.5 M Tris, pH 11, 5% SDS at 95°C for 10 min. Protein concentrations were determined via BCA assay (Pierce) or Nanodrop spectrophotometer (Thermo Scientific). Equivalent protein quantities were separated by SDS–PAGE, transferred to nitrocellulose membranes, blocked in 5% nonfat dry milk/Tris-buffered saline, and processed for immunoblotting. Antibodies used include SRA (affinity purified rabbit polyclonal antisera, 0.8 µg/mL), SRB (Santa Cruz, sc-376723, 1:100 dilution), SRP54 (Santa Cruz, sc-393855, 1:50 dilution), SRP72 (Thermo Scientific, PA5-49601, 1:500 dilution), GAPDH (DSHB, DSHB-hGAPDH-2G7, 1:500 dilution), Tubulin (DSHB, E-7, 1:1000 dilution), GRP94 (rabbit polyclonal antisera, 1:2000 dilution), and TRAPα (Migliaccio et al. 1992; 1:1000 dilution).
Proteasome inhibition
Where indicated, cells were treated with 10 µM MG132 for 16 h in complete culture media. Cells were then lysed, proteins TCA precipitated, and samples analyzed via immunoblot as described above.
SRB complementation
Cells were transfected with 0.2 µg/mL (1×) or 0.4 µg/mL (2×) SRB expression-ready cDNA plasmid [Transomics, pCS6(BC065299)] or pCMV-SPORT6 empty vector using Lipofectamine 2000, per the manufacturer's recommendation. Samples were processed 48 h post-transfection.
RNA extraction
All samples and reagents were RNase-free and kept on ice unless otherwise specified. RNA was extracted from subcellular fractions or total cell pellets by guanidinium thiocyanate (GT)-phenol–chloroform extraction as described in Chomczynski and Sacchi (2006). Briefly, 2:1 GT: phenol was added to fractions or cell pellets, inverted to mix, and incubated on ice for 15 min. Chloroform was then added to each sample, shaken by hand for 10 sec, and incubated on ice for 15 min. Samples were then phase separated via centrifugation, the aqueous phase was collected, combined with an equal volume of 100% isopropanol, and samples were inverted to mix. After incubation at −20°C, RNA was pelleted by centrifugation, reprecipitated with 1:1 GT: isopropanol, washed twice with 75% ethanol, dried at 65°C, resuspended in nuclease-free water, and RNA purity and concentration were assessed via Nanodrop Spectrophotometer (Thermo Scientific). RNA samples were then used for RNA-seq, RT-PCR, or RT-qPCR as described below.
Reverse transcription and qPCR
Reverse transcription was performed with equal quantities of input total RNA using the iScript cDNA Synthesis Kit (BioRad), per the manufacturer's protocol. cDNA products were diluted 1:10 with nuclease-free water, and quantitative PCR (qPCR) was performed using Luna Universal qPCR Master Mix (New England Biolabs) following the manufacturer's recommendation and a T100 PCR Thermal Cycler (BioRad, 1861096). qPCR data were analyzed with BioRad CFX Maestro software. Results were reported as relative expression between experimental and parental cell lines for a given cell type after normalization to GAPDH mRNA levels. In experiments where mRNA partitioning between the cytosol and ER compartments was examined by RT-qPCR, ΔCq values were determined, normalized to the total, and fractional mRNA distributions calculated. This analysis assumes equivalent PCR efficiencies for the paired cytosol and ER (membrane) fractions. Primer sequences include SRA, 5′-ACCTGTGAGGTCCATGATTGA-3′ (forward) and 5′-GGTTTGCTGGTAGCCAAAGGA-3′ (reverse); SRB, 5′-AGTAGTGGTGGCGGTTCTTG-3′ (forward) and 5′-ACGTTTTCCCGGAATCACAAAG-3′ (reverse); GAPDH, 5′-TCATCAGCAATGCCTCCTGC-3′ (forward) and 5′-GATGGCATGGACTGTGGTCA-3′ (reverse); GRP94, 5′-CTGGAAATGAGGAACTAACAGTCA-3′ (forward) and 5′-TCTTCTCTGGTCATTCCTACACC-3′ (reverse); GRP78, 5′-CAACCAACTGTTACAATCAAGGTC-3′ (forward) and 5′-CAAAGGTGACTTCAATCTGTGG-3′ (reverse); B2M, 5′-TTCTGGCCTGGAGGCTATC-3′ (forward) and 5′-TCAGGAAATTTGACTTTCCATTC-3′ (reverse). For SRB splicing variant analysis, the following primer sets were used: Set 1: (forward) 5′-AGTAGTGGTGGCGGTTCTTG-3′, (reverse) 5′-ACGTTTTCCCGGAATCACAAAG-3′; Set 2: (forward) 5′-AGTAGTGGTGGCGGTTCTTG-3′, (reverse) 5′-CAGCACAGCTGTCAGTAATGG-3′; Set 3: (forward) 5′-TCTGACCTTGATTGACCTTCC-3′, (reverse) 5′-CAGACCCATACTGTCAATGAGG-3′; Set 4: (forward) 5′-CAATGGCAAAAATCAGCAAAG-3′, (reverse) 5′-CAAGTCCTGGATGTCAGCAG (reverse); Set 5: (forward) 5′-TGCAATGGCAAAATCAGCAAAG-3′, (reverse) 5′-GAACTCCACTTTGAGGGGCA-3′.
For noncoding RNA studies, the following primer sets were used: NORAD (forward) 5′-CTC-TGC-TGT-GGC-TGC-CC-3′, (reverse) 5′-GGG-TGG-GAA-AGA-GAG-GTT-CG-3′; MALAT1 (forward) 5′-ACG-ATG-GTG-TCG-AGG-TCT-TT-3′, (reverse) 5′-TCC-CAC-CCA-GCA-TTA-CAG-TT-3′; NEAT1 (forward) 5′-GTG-GCT-GTT-GGA-GTC-GGT-AT-3′, (reverse) 5′-TAA-CAA-ACC-ACG-GTC-CAT-GA-3′.
Polysome gradients and RT-PCR
Polyribosome profiling was performed on cell lysates prepared in DDM lysis buffer (200 mM KCl, 25 mM K-HEPES, pH 7.2, 10 mM MgOAc2, 2 mM DTT, 100 µg/mL cycloheximide, 1× Roche cOmplete protease inhibitor, 40 U/mL RNaseOUT, and 2% DDM) and resolved on 15%–50% sucrose gradients. Sucrose gradients were fractionated using a Teledyne/Isco gradient fractionator as described previously (Stephens and Nicchitta 2007; Stephens et al. 2008). Total RNA was extracted from collected gradient fractions and reverse transcribed as described above using equal gradient fraction volumes. Equal volumes of cDNA reaction products were used for PCR analysis, performed using Taq DNA polymerase and 10× ThermoPol buffer (NEB), per the manufacturer's recommendation. PCR products were resolved on a 2% agarose gel containing SYBR Safe DNA stain (Thermo Fisher) and visualized using an Amersham Imager 600 (GE Healthcare).
siRNA transfections
HeLa Cas9 WT and HeLa Cas9 SRB KO2 cells were transfected at 60%–80% confluency with nontargeting (Silencer Select Negative Control No. 1 siRNA, Thermo Fisher) or SRA (Silencer Select SRPRA siRNA ID s13458, Thermo Fisher) siRNA using Lipofectamine RNAiMax (Thermo Fisher) following the manufacturer's protocol. One-half of the recommended transfection reagent concentration was used to reduce post-transfection toxicity. Cells were grown for 24–96 h, as indicated, and assayed for protein or RNA content as described above. In experiments examining the effects of combined SRA/SRB knockdown on mRNA localization to the ER, HeLa Cas9 WT cells were transfected with either nontargeting siRNA control, as noted above, or with pooled SRA and SRB siRNA (25 pmol Silencer Select SRPRA siRNA ID s13458, 25 pmol Silencer Select SRPRB siRNA ID s33819). After a 96 h culture period, cells were fractionated into cytosol and ER (membrane) fractions by sequential detergent extraction, as described above, and mRNA levels in the two fractions determined as described above for reverse transcription and qPCR.
Immunofluorescence
For optical imaging experiments, HeLa cells were seeded onto 12 mm round #1 glass coverslips; for 293T cells, coverslips were precoated with poly-l-lysine. Cells were washed with PBS and fixed with 4% paraformaldehyde in PBS for 15 min at room temperature. Cells were then washed with PBS and permeabilized with 0.1% Triton X-100 for 5 min on ice. Cells were blocked in 1% BSA in PBS, stained with primary antibody (polyclonal TRAPα antisera) rabbit, 1:100 dilution and monoclonal tubulin hybridoma antisera, DSHB, E7, mouse, 1:200 dilution), and counterstained with secondary antibody (goat anti-rabbit AlexaFluor 488, Invitrogen, 1:2000 dilution and goat anti-mouse AlexaFluor 647, Invitrogen, 1:2000 dilution) and 1 µg/mL DAPI (Sigma, MBD0015). Stained coverslips were mounted with FluorSave Mounting Reagent (EMD Millipore). Images were obtained on a DeltaVision deconvolution microscope (Applied Precision) with 60× NA 1.4 oil immersion objective (UPlanSApo 100XO; Olympus) and a high-resolution CCD camera (CoolSNAP HQ2; Photometrics). Z-stacks were acquired at 0.2 µm steps using identical exposure conditions across samples for a given protein. Data were deconvolved using the SoftWoRx program (Applied Precision) and further processed using ImageJ/Fiji software to merge channels, linearly adjust contrast, and pseudo color images. All changes were applied uniformly across all images for a given experiment.
Single-molecule fluorescence in situ hybridization
SRB KO2 cells transfected with either nontargeting siRNA or SRA-targeting siRNA were seeded to 60% confluency at the time of transfection and assayed 96 h post-transfection (∼90% confluency). HeLa Cas9 WT and SRB KO2 were seeded to 90% confluency and assayed in parallel with transfected cells. Cells were seeded onto 12 mm round #2 glass coverslips in 24-well plates. Media was removed from wells, cells were washed with DEPC-treated PBS, and fixed with 3.7% paraformaldehyde for 15 min at room temperature. Cells were washed with DEPC-PBS and permeabilized with 0.1% Triton X-100 for 5 min on ice. Cells were incubated in Stellaris Wash Buffer for 5 min at room temperature. A humidified chamber was assembled, and coverslips were incubated in 30 µL Stellaris Hybridization buffer plus 0.3 µL Stellaris respective probe(s) at 37°C overnight in the dark. Coverslips were returned to a 24-well plate, cell-side up, and washed with Stellaris Wash Buffer A for 5 min. DAPI stain comprised 30 µL Stellaris Wash Buffer A + 0.05 µg/mL DAPI. Cells were incubated with 30 µL DAPI stain for 15–30 min in the dark at 37°C. Coverslips were then incubated with Stellaris Wash Buffer B for 5 min at room temperature. Images were obtained on a DeltaVision deconvolution microscope with 60× NA 1.4 oil immersion objective and high-resolution CCD camera, as noted above. For a given transcript, sample exposure conditions were identical, and Z-stacks were obtained in 0.2 µm steps. Deconvolution was performed on SoftWoRx software and image processing performed using ImageJ/Fiji software to merge channels, produce maximum intensity projections, linearly adjust contrast, and pseudo color images. Cell outlines were manually mapped from paired DIC micrographs.
Cell proliferation
Cell proliferation was assessed by labeling cell monolayers with 1 µM CFSE (Thermo Fisher, C34554) for HeLa cell lines or 0.5 µM CFSE for 293T cell lines, per the manufacturer's recommendation. Cells were collected, fixed in 1% formaldehyde, and assayed on a CANTO II Flow Cytometer (BD Biosciences) immediately following fixation. Data were visualized using FlowJo software (BD Biosciences).
[35S] Methionine/cysteine incorporation
Cells were methionine starved for 15 min in methionine- and cysteine-free media at 37°C and then labeled with 50 µCi/mL [35S] methionine/cysteine in methionine- and cysteine-free media for 7.5 min. After the labeling period, cells were washed twice with media containing 100 µg/mL cycloheximide, incubated in the second wash for 10 min at 37°C, washed twice in PBS containing 100 µg/mL cycloheximide, and then lysed for 10 min at room temperature in RIPA buffer containing 100 µg/mL cycloheximide and 1 mM PMSF. Cycloheximide controls were prepared in parallel, with cycloheximide addition prior to [35S] methionine/cysteine. Lysates were collected and cleared by centrifugation (12,000 rpm, 5 min and 4°C). Proteins were precipitated from cleared lysates with 10% final TCA concentration (wt/vol), protein pellets were washed four times with ice-cold 10% TCA, and then washed three times with ice-cold acetone. Washed pellets were dried at 95°C and resuspended in 0.5 M Tris, pH 11, 5% SDS. Radioactivity was assessed by liquid scintillation counting, and protein concentration was assessed by BCA assay (Pierce). Radioactivity data are reported as counts per minute (CPM) per milligram (mg) of protein for experimental samples minus average CPM/mg of cycloheximide controls.
Cell fractionation for quantitative proteomics
HeLa Cas9 WT cells were grown in SILAC media (DMEM, Athens ES, 0420, supplemented with l-glutamine, sodium pyruvate, pen/strep/antifungal, 10% dialyzed FBS, methionine, leucine, and proline) with light arginine and lysine, and HeLa Cas9 SRB KO cells were grown in SILAC media with heavy arginine and lysine (13C6 15N4-l-Arg and 13C6 15N2-l-Lys) for 7 d. On the third day of labeling, SRB KO cells were transfected with SRA siRNA and wild-type cells were transfected with nontargeting siRNA, as described above, in duplicate. Transfected cells were cultured in the appropriate SILAC media for an additional 96 h. At this time point, an equal number of cells from matched replicates (i.e., wild-type, light-labeled replicate and SR-KO, heavy-labeled replicate) were combined, washed twice in HBS, swelled in 15 mM KCl, 1.5 mM MgOAc2, 1 mM DTT, 10 mM HEPES-KOH, pH 7.5, with protease inhibitor cocktail on ice for 10 min, and homogenized with 25 strokes of a Dounce homogenizer with a tight pestle. Osmotic balancer (375 mM KCl, 22.5 mM MgOAc2, 1 mM DTT, 220 mM HEPES-KOH, pH 7.5, 1× protease inhibitor; 1/5 volume), was added to the homogenate. Total membranes were isolated from homogenate via ultracentrifugation in a TLA 100.3 rotor at 45,000 rpm for 40 min at 4°C. Supernatants from total membrane centrifugation were collected, centrifuged in a TLA 100.3 rotor at 50,000 rpm for 60 min at 4°C to clear, and TCA precipitated as the cytosol samples. Total membrane pellets were resuspended in 100 mM sodium carbonate, pH 11, plus 4 M urea, homogenized with 100 passes of a Dounce homogenizer with a tight pestle, incubated on ice for 30 min, and centrifuged in a TLA 100.3 rotor at 90,000 rpm for 30 min at 4°C. Carbonate/urea supernatants were collected, and TCA precipitated as the peripheral membrane fraction. Carbonate/urea pellets were gently washed with water and stored as the integral membrane fraction.
Proteomics sample preparation and proteolytic digestion
Cell homogenate-derived protein fractions were resuspended in denaturing buffer (9 M urea, 10 mM HEPES, pH 8.5, 15 mM NaCl) and protein concentrations were measured via BCA assay (Thermo Fisher). Fifty micrograms of each sample was brought to the same volume (150 µL) with lysis buffer. In parallel, 8 µg of each sample (48 µg total) were combined and the volume brought to 150 µL with lysis buffer to serve as a control sample. 1,4-dithiothreitol (DTT) was added to each sample to 1 mM final concentration and incubated at 60°C for 15 min (Eppendorf, Thermomixer C). Iodoacetamide was then added to 1.6 mM per sample and incubated at room temperature for 20 min in the dark. All reactions were quenched with an additional 1 mM DTT. Three hundred and thirty microliters of H2O and 40 µL 100 mM HEPES (pH 8.5) were added to each sample for enzymatic digestion. Fifteen microliters of Tryp/LysC (0.1 µg/µL, Thermo Fisher Scientific) was added to each sample and shaken at 37°C for 12 h (Eppendorf, Thermomixer C). An additional 5 µL of Tryp/LysC was added to each sample after the 12 h incubation and incubated an additional 4 h at 37°C. Sixty microliters of 10% trifluoroacetic acid was added to each sample to quench the trypsin reaction after the 16 h total incubation. Each sample was then passed through a SEK PAK column (SOLA HRP SPE, Cat. No. 60109-001), and eluates from each sample were dried via Speedvac concentrator (Thermo Fisher Scientific) for TMT labeling.
TMT labeling and TMT label assessment
Dried samples were resuspended in 50 µL 100 mM HEPES (pH 8.5) and gently vortexed. TMT labels (as indicated in Fig. 4A) were resuspended in acetonitrile (Optima, LC/MS grade, Fisher Chemical), and 20 µL of TMT reagent was added to the appropriate samples. All samples were incubated at room temperature for 1 h. An amount of 4 µL of each TMT labeled sample was removed and combined to perform a label quality assessment (Nusinow et al. 2020), which also served as a normalization marker for downstream analysis. The TMT label assessment mixture was desalted with C18 stage tips (PhyNexus Inc.) and combined with 80 µL reconstitution buffer (0.1% formic acid). LC/MS analysis of the label assessment sample identified 9235 TMT labeled peptides in 9280 total peptides. An amount of 35 µL of 5% hydroxylamine solution was added to each TMT labeled sample to quench the TMT reaction. Equal masses of TMT labeled samples were mixed according to the label assessment LC/MS data and separated via high pH reverse phase high-performance liquid chromatography (HPLC), as described below.
High pH reverse phase high-performance liquid chromatography fractionation
The TMT labeled mixture was fractionated by high pH reverse phase HPLC (Vanquish HPLC, Thermo Fisher Scientific). A total of 96 fractions were collected over 75 min at a flow rate of 0.5 mL/min with mobile phase A as 20 mM formic acetate, pH 9.3 in deionized water and mobile phase B as acetonitrile (Optima, LC/MS grade, Fisher Chemical) with 20 mM formic acetate, pH 9.3. Fractions were pooled into 12 total samples (i.e., eight fractions per sample) and were dried and desalted using C18 stage tips (PhyNexus Inc.) before LC–MS–MS.
Liquid chromatography—tandem mass spectrometry (LC–MS–MS)
Fractionated samples were analyzed by nano flow HPLC (Ultimate 3000, Thermo Fisher Scientific), followed by Thermo Orbitrap Mass Spectrometer (Q-Exactive HF-X), and a Nanospray Flex Ion Source (Thermo Fisher Scientific) equipped with a Column Oven (PRSO-V2, Sonation) to heat the nano column (PicoFrit, 100 µm × 250 mm × 15 µm tip, New Objective) for peptide separation. The nano LC method was water/acetonitrile-based and 210 min long with a 0.25 µL/min flow rate. For each TMT fraction, all TMT labeled peptides were first captured on a trap column (No. 160454, Thermo Fisher) and were then delivered to the separation nano column by the mobile phase. A TMT-specific MS2-based mass spectrometry method on QE HF-X was used to sequence TMT peptides that were eluted from the nano column. For the full MS, 120,000 resolutions were used with a 3E6 AGC target or 50 msec IT, with a scan range of 300–1500 m/z. For the dd-MS(MS/MS), 60,000 resolutions were used with a 1E5 AGC target or 100 msec IT. An isolation window of 0.7 Da with a fixed first mass of 110.0 Da was used. Normalized collision energy (NCE) was set to 32 with a 15-cycle loop.
Quantitative proteomic analysis
Collected LC–MS data were analyzed by Proteome Discoverer 2.4 (Thermo Fisher). Because all peptides were labeled with SILAC and TMT tags, multiple quantitative proteomics searches were needed to deconvolve the complex data set. Therefore, a TMT database search was performed separately from a SILAC database search, providing TMT quantitation separate from SILAC protein abundance (Welle et al. 2016). All searches were performed in the Sequest HT node with mass tolerance of 20 ppm MS1 and 0.05 Da for MS2. Homo sapiens database (UP000005640) from Swiss-Prot was used. Percolator node was used for peptide FDR filtering (strict: 0.01, relaxed: 0.05). TMT search: TMT quantitative search was performed for heavy peptides and light peptides. For heavy-labeled TMT search, TMT-based modification (+237.177 Da) was added to accommodate the fact that all TMT labeled lysines were heavy lysine (+8.014 Da). Both heavy TMT modification (+237.177 Da) and heavy Arginine (+10.008 Da) were set as static modification. A standard TMT quantitative proteomics search was performed for the light TMT peptides. SILAC search: SILAC search was performed to parse out heavy-labeled peptides from the light peptides. Standard TMT tag mass (+229.163 Da) was used as variable modification and amino-terminal modification for the SILAC quantification search. For analysis, proteins that were detected in only one cell line were assigned zero abundance values for the paired cell line. All proteomic data have been deposited at the MassIVE repository as dataset MSV000087992.
Transmission electron microscopy
HeLa Cas9 parental cells and HeLa Cas9 SRB KO cells were cultured in standard conditions (DMEM, 10% FCS, 37°C, 5% CO2). Cells were transfected with SRA-targeting siRNA or a nontargeting siRNA, and 24 h after transfection, cells were split onto #1 15 mm glass coverslips and cultured in 12-well culture plates. At 96 h post-transfection, the media was removed and replaced with 2.5% glutaraldehyde in 0.1 M sodium cacodylate, pH 7.4 and fixed for 1 h at RT. Following the glutaraldehyde fixation period, the 2.5% glutaraldehyde in 0.1 M sodium cacodylate, pH 7.4 fixation buffer was removed and replaced with 2% paraformaldehyde in 0.1 M sodium cacodylate, pH 7.4, and the tissue culture plates stored overnight at 4°C. Subsequently, the 2% paraformaldehyde in 0.1 M sodium cacodylate, pH 7.4 fixation buffer was removed and replaced with 0.1 M sodium phosphate, pH 7.4 and shipped on ice to the Center for Cellular and Molecular Imaging, Electron Microscopy Facility at Yale Medical School. Cell samples were post-fixed in 1% osmium tetroxide for 1 h and stained en-bloc in aqueous 2% uranyl acetate for 1 h, rinsed in distilled water, dehydrated in an ethanol series and resin infiltrated with Embed 812 (Electron Microscopy Sciences). Samples were placed in silicone molds and cured at 60°C for 24 h. Resin blocks were sectioned on a Leica UltraCut UC7. Sixty-nanometer sections were collected on formvar-coated nickel grids and stained using 2% uranyl acetate and lead citrate. Electron micrographs were obtained on a FEI Tencai Biotwin TEM at 80Kv using a Morada CCD and iTEM (Olympus) cellSens Dimension software. Micrographs were blinded and mitochondrial surface areas determined using Image J, by the method of Lam et al. (2021). An amount of 120–150 individual mitochondria were quantified for each condition.
RNA gel electrophoresis
Cell equivalent volumes of RNA extracted from cytosol and ER fractions were diluted twofold with RNA-loading dye (80% formamide, 1 mg/mL xylenol blue, 1mg/mL bromophenol blue, 10 mM EDTA), heated to 65°C for 10 min to denature RNA secondary structure, and separated via electrophoresis in 1% agarose containing SYBR Safe (Thermo Fisher). RNA was visualized via green fluorescence on an Amersham Imager 600 (GE Healthcare).
4-Thiouridine pulse-chase labeling, RNA biotinylation, and detection
Cell cultures were supplemented with 200 µM 4SU (Sigma) for 15 min in DMEM, 10% FBS (pulse). Labeled cells were washed with 1 mM uridine in PBS and then incubated in 1 mM uridine in DMEM, 10% FBS for 0, 1.5, 3, or 6 h (chase). At the indicated time points, cells were washed twice with PBS, incubated on ice, and processed for sequential detergent fractionation as described. Total RNA from the resulting cytosol and ER fractions was extracted by GT-phenol–chloroform as described above. Control samples were processed identically with the exception that 4SU was omitted (mock pulse).
An amount of 100 µg of 4SU-labeled or control RNA was collected from cytosol and ER fractions, or pooled polysome gradient fractions, and treated with DNase I (New England Biolabs) for 10 min at 37°C. DNase I was then inactivated with 5 mM EDTA at 75°C for 10 min. DNA-free RNA was purified using GT-phenol–chloroform extraction as above. An amount of 50 µg RNA per sample was incubated with 5 µg MTSEA-biotin (Biotium) in 10 mM HEPES, pH 7.5, 1 mM EDTA, 20% dimethylformamide for 2 h at RT in light-protected sample tubes. Total biotinylated RNA (including biotinylated, 4SU-labeled RNA and nonlabeled RNA synthesized before or after the 4SU pulse) was extracted with phenol/chloroform/isoamyl alcohol (25:24:1). For assessment of 4SU-labeled rRNA, biotinylated RNA was separated on a 0.8% agarose gel as described above. Electrophoresed RNA was transferred to a nitrocellulose membrane overnight with 10× saline sodium citrate (SSC). RNA was cross-linked to the membrane using a UV crosslinker and stained with methylene blue solution (0.02% wt/vol in 0.3 M sodium acetate pH 5.5, 3–5 min). The membrane was imaged on an Amersham Imager 600 (GE Healthcare) as total, input RNA. The membrane was then destained with 0.2× SSC, 1% wt/vol SDS for 15 min and rinsed with nuclease-free water. To assess 4SU-labled RNA on the destained membrane, the biotinylated RNA was detected using a streptavidin-coupled antibody. The membrane was first equilibrated in 10% SDS, 1 mM EDTA in PBS with gentle shaking for 1.5 h. The membrane was then stained with IRDye 800CW Streptavidin (LI-COR Inc.) at a 1:10,000 dilution in 10% SDS, 1 mM EDTA in PBS for 30 min at room temperature with gentle shaking, protected from light. The membrane was then washed in sequential washes of 10% SDS in PBS, 1% SDS in PBS, and 0.1% SDS in PBS for 8 min each. Finally, the membrane was washed in PBS for 5 min, and IRDye was imaged on an Odyssey Clx (LI-COR Inc.) to detect 4SU-labeled, biotinylated RNA. IRDye signal intensity was quantitated using Empiria Studio Software (LI-COR Inc.) where indicated.
Analysis of noncoding RNA subcellular distributions
HeLa cells at ∼80% confluence were fractionated as described in the Sequential Detergent Fractionation section above, with the exception that fractionations were conducted on the adherent cells. Following solubilization with the DDM-supplemented membrane solubilization buffer, which leaves nuclei intact, the nuclear fraction was obtained by addition of 1.0 mL of a TRIzol/10 cm dish. Cytosol and ER fractions were extracted with TRIzol according to the manufacturer's recommendations for aqueous samples. Total RNA was recovered by phase separation of the TRIzol extracts with quantification by UV spectrometry.
RNA-seq library construction
An amount of 5 µg of RNA extracted from the cytosol, ER, or total cell fractions was DNase treated using TURBO DNase (Thermo) for 30 min at 37°C per the manufacturer's recommendation. DNase was deactivated by adding 0.1× volume 25 mM EDTA to each reaction and heating to 65°C for 10 min. DNase-treated RNA was precipitated by adding 2.5× volume 100% ethanol and 0.1× 3 M NaOAc, pH 5.2, mixing by inversion, and incubating at −20°C for 30 min. Samples were then centrifuged (14,000 rpm, 30 min, at 4°C). Precipitated pellets were washed twice by adding 500 µL 75% ethanol, incubating at room temperature for 10 min, centrifuging at 14,000 rpm, 10 min, 4°C, and repeating. Washed pellets were dried for 10 min at 65°C and 20 µL DEPC-treated water was added to each dried pellet. Samples were heated to 65°C for 10 min to aid resuspension, and RNA purity and concentration were assessed via Nanodrop Spectrophotometer (Thermo Fisher). rRNA depletion was performed on 1 µg DNase-treated RNA per sample using either the NEBNext rRNA Depletion Kit (human/mouse/rat, NEB #E6310) or the KAPA RiboErase Kit (H/M/R, KAPA Biosystems), following the manufacturer's recommendation, except the HighPrep PCR Clean-up System (MagBio) was used for RNA and cDNA cleanup steps in place of the suggested magnetic bead systems. Briefly, for the NEBNext rRNA Depletion Kit, DNase-treated RNA was diluted to 1 µg in 12 total microliters with nuclease-free water. RNA was combined with rRNA depletion solution and hybridization buffer and annealed by heating to 95°C and then ramping down to 22°C at 0.1°C/sec. Annealed RNA was combined with RNase H and buffer and heated to 37°C for 30 min. Digested RNA was then combined with DNase and buffer and heated to 37°C for 30 min. rRNA-depleted RNA was then purified using HighPrep beads. For KAPA RiboErase, DNase-treated RNA was diluted to 1 µg in 10 total µL with nuclease-free water. RNA was combined with hybridization buffer and hybridization oligos and annealed by heating to 95°C and then ramped down to 45°C at 0.1°C/sec. RNase H and buffer were added to annealed RNA and heated to 37°C for 30 min. Digested RNA was isolated using HighPrep beads as described. Beads containing cleaned and digested RNA were then resuspended in DNase and buffer to elute. Once separated from the beads, eluted RNA in DNase and buffer were heated to 37°C for 30 min. rRNA-depleted RNA was then purified using HighPrep beads.
rRNA-depleted RNA was used in RNA-seq library construction with the NEBNext Ultra II RNA Library Prep Kit for Illumina (NEB #E7770), per the manufacturer's recommendation, except that SPRIselect beads were replaced with the HighPrep PCR Clean-up System (MagBio). Briefly, RNA was fragmented using the suggested incubation for intact RNA (RIN > 7), samples were combined with first-strand buffer and random primers, heated to 94°C for 15 min, and immediately placed on ice. First-strand synthesis was then completed, immediately followed by second-strand synthesis. cDNA was purified using HighPrep beads and was eluted in 0.1× TE Buffer. cDNA ends were repaired using NEB End Prep Enzyme Mix and Buffer. Adaptors were ligated to the cDNA using 1:5 diluted adaptors, ligation enhancer, and ligation master mix. Adaptor-ligated cDNA was purified using HighPrep beads. Purified cDNA was then amplified via PCR using NEBNext Index Primers for Illumina 1-48 (NEB #7335, #E7500, #E7710, and #E7730) and seven cycles of extension, as recommended for 1 µg RNA input. PCR amplified cDNA was purified using HighPrep beads and eluted in 20 µL 0.1× TE Buffer. cDNA Libraries were then sequenced on the NovaSeq 6000 platform by the Duke Center for Genomic and Computational Biology.
RNA-seq data analysis
RNA-seq reads were analyzed using Kallisto (Bray et al. 2016). A Kallisto index was built from all RefSeq genes (downloaded from https://ftp.ncbi.nlm.nih.gov/refseq/H_sapiens/mRNA_Prot/ on 04.06.2018). Illumina read files were mapped to the RefSeq index at default paired end settings. Mapped reads were transformed to transcript per million (TPM), including only annotated mRNAs (NM prefix) and summed, to generate a TPM/gene metric.
4SU-seq library preparation
Cells were pulse-labeled with 4SU, incubated in 1 mM uridine for 15, 30, 45, or 60 min (chase), fractionated, and RNA extracted as described above. Where indicated, 1 mM DTT or 2 µg/mL harringtonine was added at the start of the 4SU pulse and included in the chase buffers. An amount of 100 µg of 4SU-labeled or control RNA was collected from cytosol and ER fractions and experiments were performed in biological triplicate. An amount of 10 ng of a Bacillus subtilis in vitro transcribed thiolated mRNA (spike-in700) was added to each sample to correct for fractional losses and recovery during subsequent biotin labeling and isolation procedures (Neymotin et al. 2014). In vitro transcriptions were performed with 4-thioUTP/UTP admixtures using a B. subtilis sequence cloned into pSP64 (Polyansky et al. 2013) as the DNA template. The B. subtilis pSP64 (spike-in700) construct was the kind gift of Dr. David Gresham, New York University. RNA samples were treated with DNase I, purified using GT-phenol–chloroform extraction, biotinylated, and extracted by phenol/chloroform/isoamyl alcohol, as described above.
Biotinylated RNAs were recovered by affinity purification using NanoLink streptavidin magnetic beads (Vector Laboratories), prepared as follows. Streptavidin magnetic beads (30 µL slurry per sample) were washed with 0.1 M NaCl, followed by three washes in 1× binding buffer (5 mM Tris, pH 7.4, 0.5 mM EDTA, 1 M NaCl). Beads were then resuspended in 2× binding buffer (10 mM Tris, pH 7.4, 1 mM EDTA, 2 M NaCl) and 1 µg tRNA (Ambion) per microliter of beads and incubated overnight at 4°C to reduce nonspecific RNA binding in subsequent steps. tRNA-blocked beads were washed three times with wash buffer (100 mM Tris, pH 7.4, 10 mM EDTA, 1 M NaCl, 0.1% Tween 20), once with 0.1 M NaCl, three times with 1× binding buffer, and resuspended in 2× binding buffer. Equal volumes of biotinylated RNA samples were added to tRNA-blocked beads (30 µL RNA sample per 30 µL blocked bead slurry in 2× binding buffer) and incubated at room temperature for 60 min protected from light. Magnetic beads, now bound with biotinylated RNA, were washed once with wash buffer preheated to 48°C and then washed six times with wash buffer at room temperature. RNA was eluted from beads by the addition of 0.1 M DTT. Biotinylated RNA elution was repeated, and eluates were combined. RNA was recovered with RNeasy MiniElute Spin columns (Qiagen) per the manufacturer's recommendation. Eluted 4SU-RNA was prepared for deep sequencing using the NEBNext Ultra II RNA Library Prep Kit for Illumina (New England Biolabs, E7770) with the NEBNext Poly(A) mRNA Magnetic Isolation Module (New England Biolabs, E7490) to de-enrich for ribosomal RNAs prior to library construction, following the manufacturer's protocol with multiplexing. Prepared cDNA libraries were sequenced using the Illumina NovaSeq6000 platform at the Duke Center for Genomic and Computational Biology Facility. As noted above, all 4SU pulse-chase studies were performed in biological triplicate. RT-qPCR analyses were performed on all replicates for marker gene distributions (GRP94, GAPDH) to validate reproducibility. Deep sequencing was performed on two of the three biological replicates.
4SU-seq data analysis
4SU-seq reads were analyzed using Kallisto (Bray et al. 2016). A Kallisto index was built from all RefSeq genes (downloaded from https://ftp.ncbi.nlm.nih.gov/refseq/H_sapiens/mRNA_Prot/ on 04.06.2018). B. subtilis spike-in700 sequence was obtained from Dr. David Gresham, New York University and is described in Neymotin et al. (2014). Illumina read files were mapped to the RefSeq index and B. subtilis spike-in sequences at default settings (single-end mapping; parameters of -1 300 -s20). Mapped reads were transformed to TPM, including only annotated mRNAs (NM prefix) and B. subtilis spike-in700 sequence and summed, to generate a TPM/gene metric. TPM values were then normalized to B. subtilis spike-in700 abundance. Background corrections, representing non-4SU labeled poly(A) mRNA recovered in paired (control) pulse-chase studies where 4SU was omitted, were performed by subtracting TPM read metrics generated from the paired (−) 4SU background control libraries, processed as above and B. subtilis spike-in700 normalized. All code used to analyze the 4SU-seq data sets is available on request. RNA-seq and 4SU-seq raw and processed read files are publicly available on GEO at record GSE164330.
Quantification and statistical analysis
Quantification of streptavidin signals from 4SU/biotin-labeled RNA gels was performed with Fiji/ImageJ (Schindelin et al. 2012). Statistical analyses, that is, mean, median, standard error, and standard deviation, were performed using Microsoft Excel.
SUPPLEMENTAL MATERIAL
Supplemental material is available for this article.
ACKNOWLEDGMENTS
The authors thank Dr. Xinran Liu, Yale University, for thoughtful advice and guidance on morphometric analysis of mitochondria and the Center for Cellular and Molecular Imaging, Electron Microscopy Facility at Yale University Medical School for transmission electron microscopy support. This work was supported by grants from the National Institutes of Health (NIH; GM139480, C.V.N.; GM139254, M.M.H.) and by a shared instrumentation grant (NIH 1S10RR027528, DeltaVisionElite).
Author contributions: Conceptualization, J.R.C. and C.V.N.; methodology, J.R.C. and C.V.N.; validation, J.R.C. and Q.C.; formal analysis, J.R.C., D.W.R., M.M.H., J.K., B.H.Y., A.C.H., and A.L.E. Investigation, J.R.C., Q.C., A.C.H.; data curation, J.R.C., D.W.R., J.K., B.H.Y., A.L.E., and M.M.H. Writing—original draft, J.R.C. and C.V.N.; writing—review and editing, J.R.C. and C.V.N.; visualization, J.R.C., D.W.R., C.V.N, A.C.H., and J.K. Supervision, C.V.N.; funding acquisition, C.V.N.
Footnotes
-
Article is online at http://www.rnajournal.org/cgi/doi/10.1261/rna.079643.123.
- Received February 25, 2023.
- Accepted July 17, 2023.
This article is distributed exclusively by the RNA Society for the first 12 months after the full-issue publication date (see http://rnajournal.cshlp.org/site/misc/terms.xhtml). After 12 months, it is available under a Creative Commons License (Attribution-NonCommercial 4.0 International), as described at http://creativecommons.org/licenses/by-nc/4.0/.




