


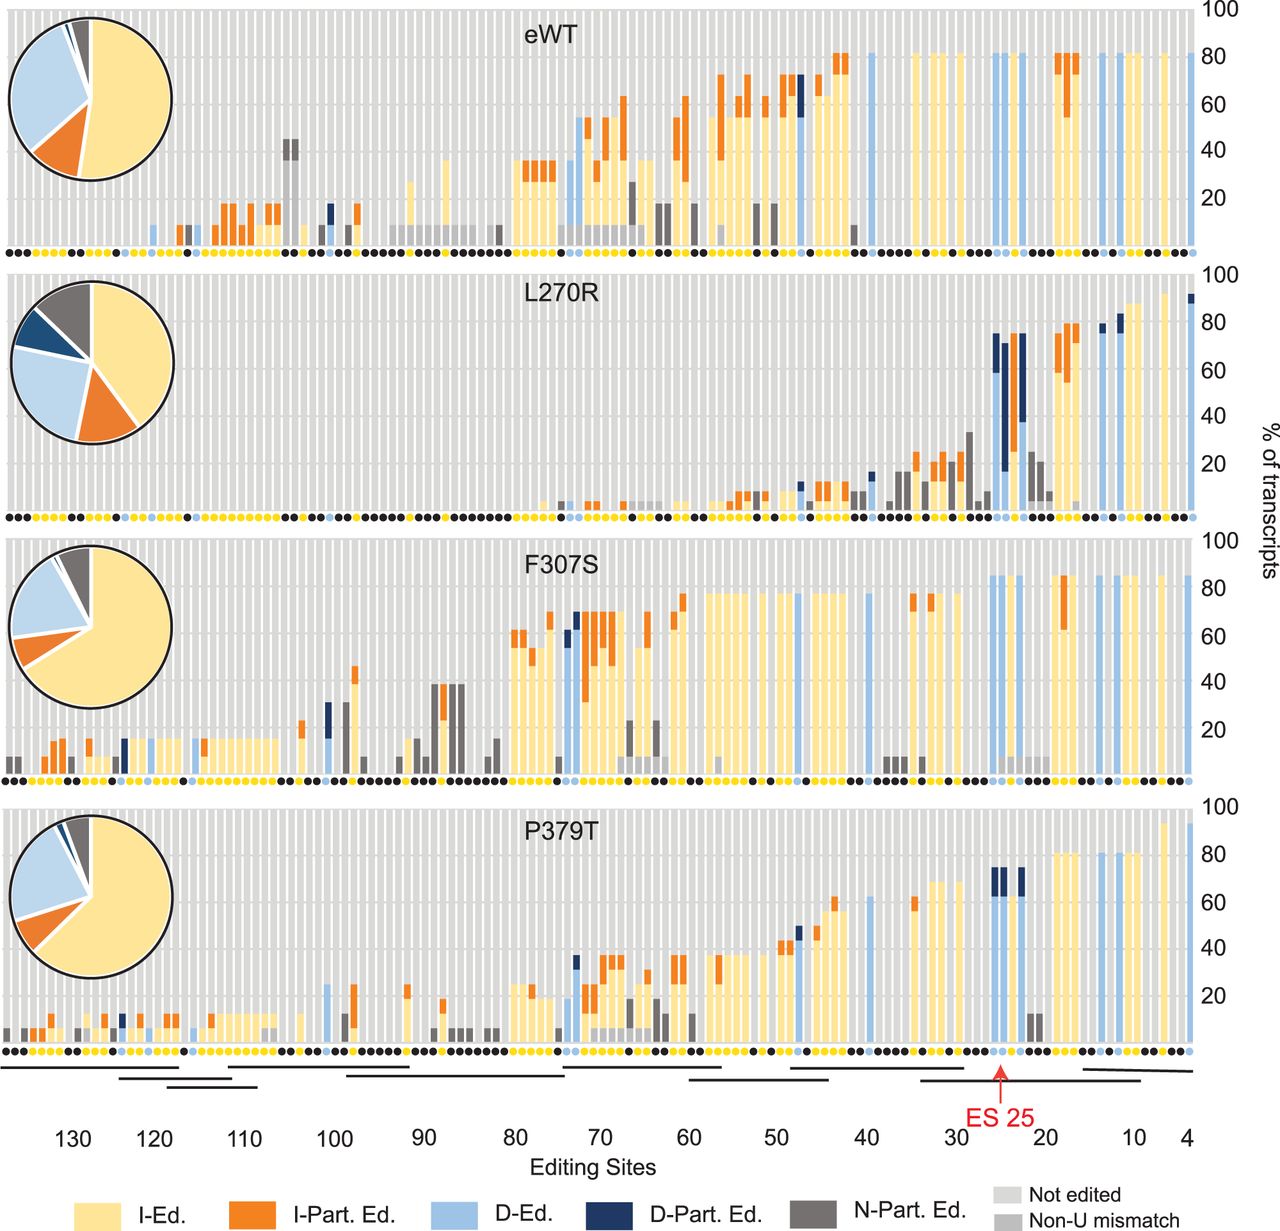
Impacts of A3 mutations in BF cell lines on cloned RPS12 sequences. A summary of the editing of cloned and sequenced RPS12 mRNAs (Supplemental Fig. S3) is summarized by the bar graph that shows the percent of the type of editing at each ES classified as (I-Ed.) fully edited insertion ES (yellow), (I-Part. Ed.) partially edited insertion ES (orange), (D-Ed.) fully edited deletion ES (light blue), (D-Part. Ed.) partially edited deletion ES (dark blue), (N-Part. Ed.) partially edited ES that is not edited in fully edited mRNA (dark gray). ESs where no editing was observed (light gray) and ESs impacted by a non-U mismatch (medium gray) are shown. Each type of editing event is shown as a percent of the total for each sample in the pie chart inserts. The colors of the small circles beneath each bar indicate the type of editing at each ES in fully edited mRNA. The approximate locations of gRNAs that can specify the edited sequences are shown by black bars (Kirby et al. 2016) and ES 25 is indicated.




