


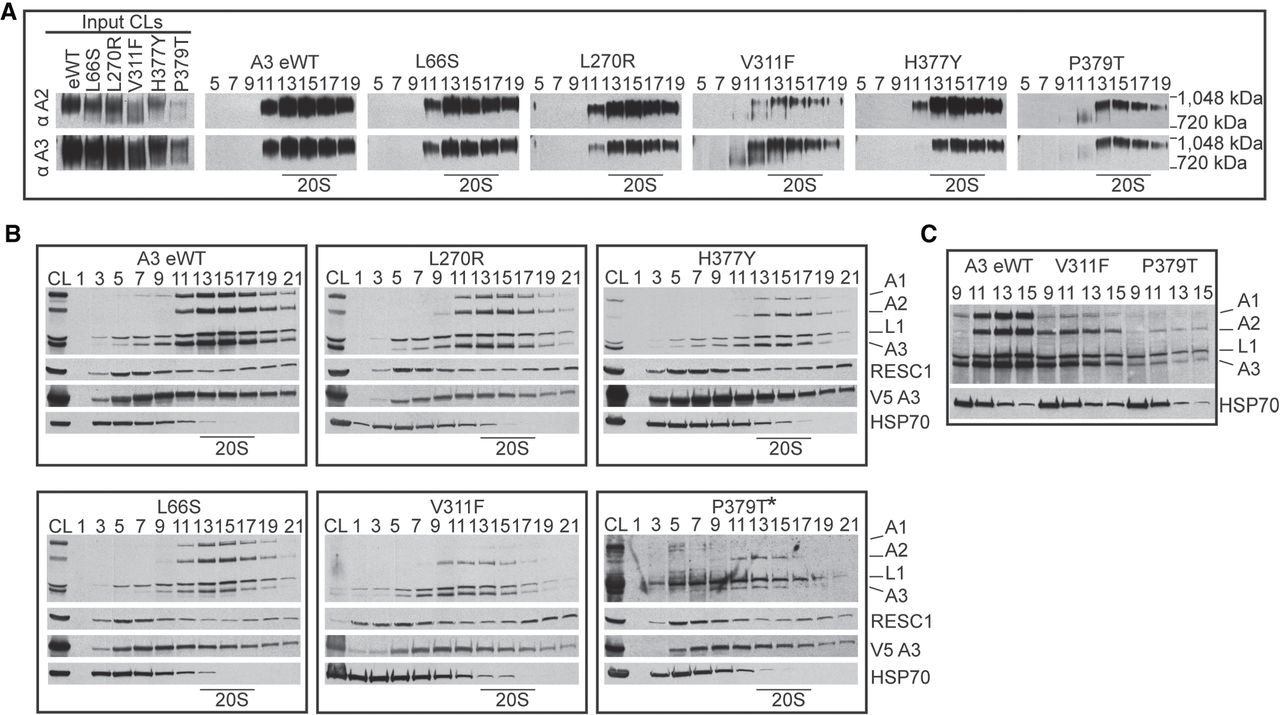
FIGURE 3.
Glycerol gradient analysis of the effects of A3 mutations on catalytic complexes. Western analysis of 10%–30% glycerol gradient fractions from lysates of the indicated cell lines probed with indicated mAbs as in Figure 2. The gradients shown represent two biological replicates for eWT and P379T and one biological replicate for L270R, L66S, V311F, and H377Y. (A) Blots of BN-PAGE of input cleared lysates (CLs) and gradient fractions. (B) SDS-PAGE followed by western blotting of input CL and of glycerol gradient fractions probed as in A. The P379T* blot used supersignal ECL and was exposed longer. (C) Selected gradient fractions for direct comparisons among eWT, V311F, and P379T.




