


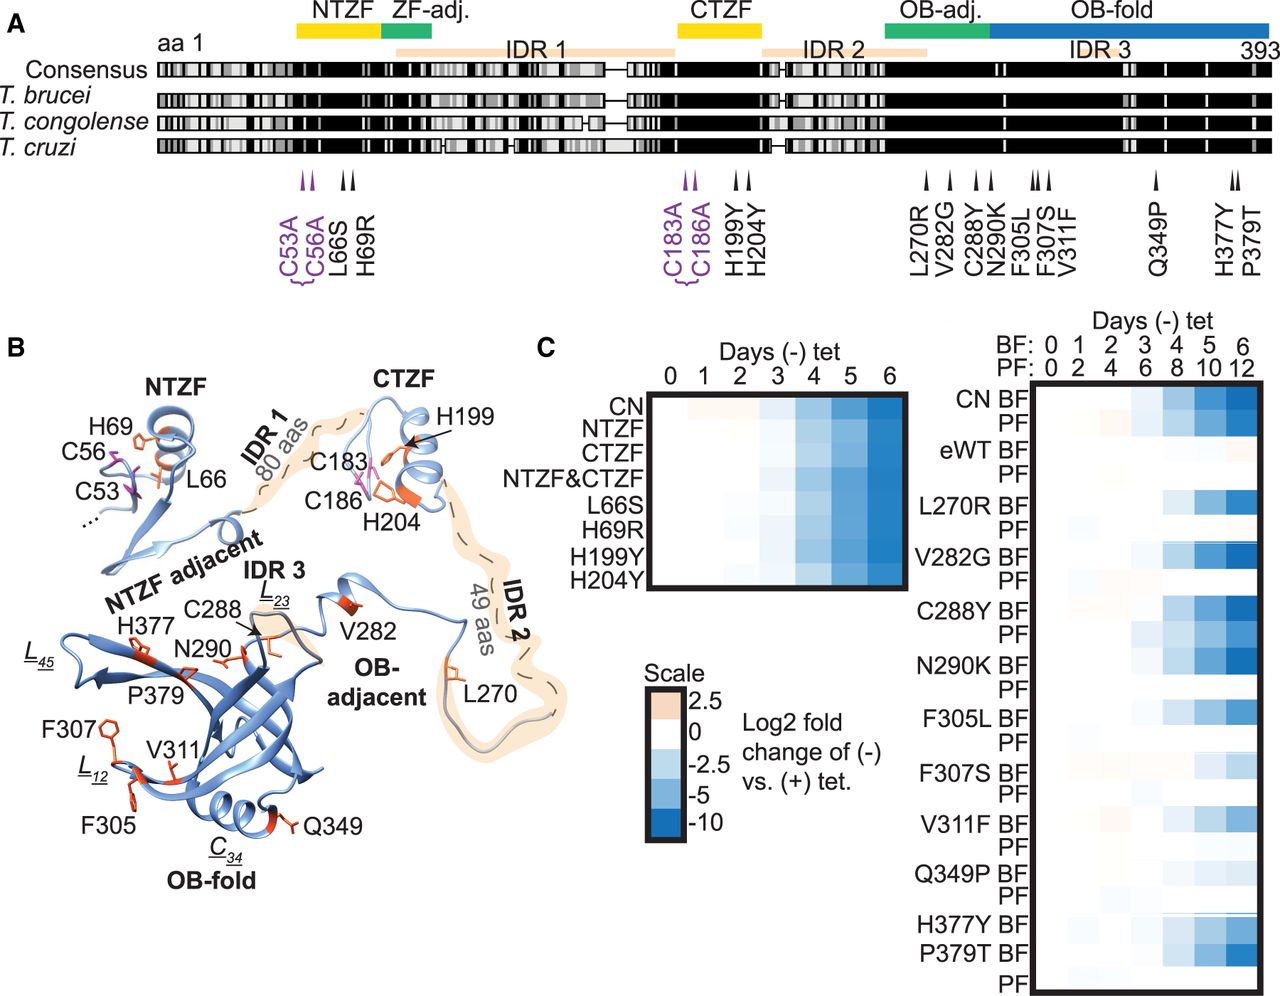
Loss of function mutations in A3 and their effects on growth. (A) Locations of single and double (bracketed) amino acid substitutions that resulted in loss of growth in BF T. brucei when exclusively expressed. Substitutions are mapped against a sequence alignment of three Trypanosoma species. Sequences were obtained from TriTrypDB and analyzed using Geneious (see Materials and Methods for gene IDs). MUSCLE alignment was highlighted using the Blosum 62 matrix, threshold 1. Black indicates amino acid similarity in all three species, and gray indicates similarity in two out of the three. The locations of the NTZF and CTZF (yellow); the OB-fold (blue) and the regions adjacent to these (green) are indicated as are three IDRs (tan). (B) Location of the substitutions in a composite A3 structure of a high confidence AlphaFold structural prediction (veb8-A) and crystal structure of the OB-fold (PDBID: 4DNI, Park and Hol 2012). Single amino acid substitutions are in orange and double C → A substitutions are in magenta. (C) Effect on growth after A3 repression (CN) or of exclusive expression of A3 (i.e., −tet) with substitutions in or near the ZFs (left) or in or near the OB-fold (right) over 6 d in BFs and 12 d PFs (see Materials and Methods for details). “eWT” indicates exclusive expression of the V5-WT allele from the tubulin locus under −tet conditions. Heat maps shown represent one biological replicate.




