


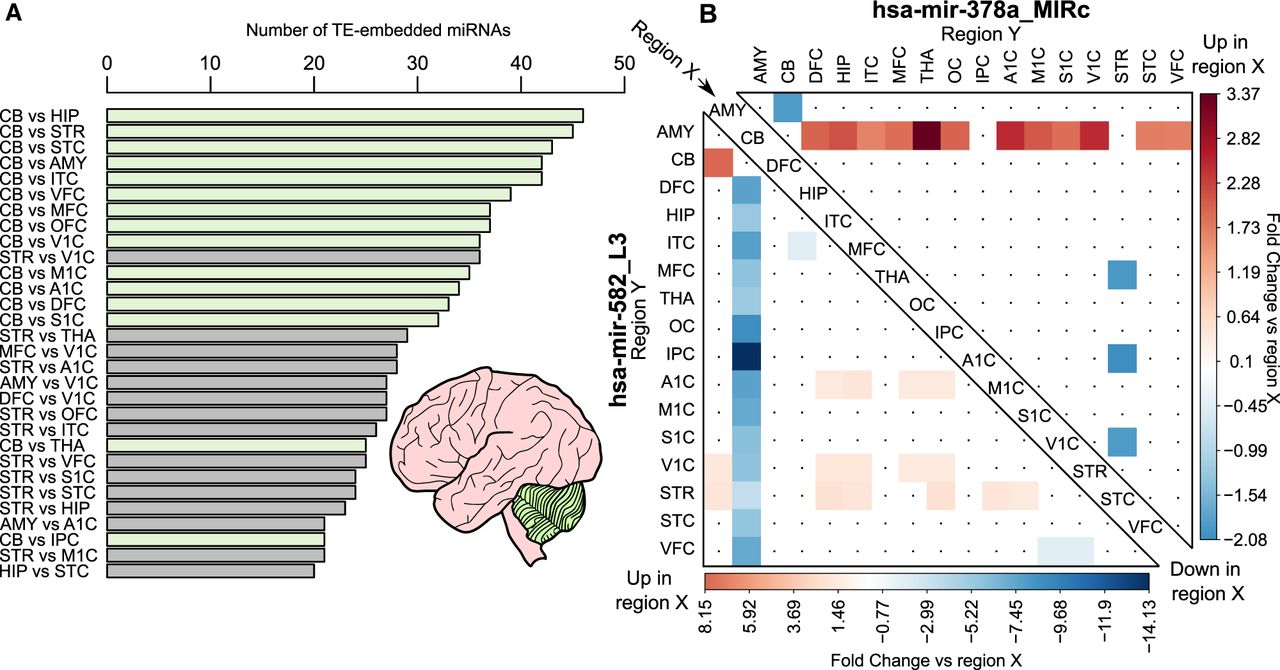
TE-embedded miRNAs exhibit spatial expression with major differences in the cerebellum. (A) Bar chart showing the number of differentially expressed TE-embedded miRNAs per regional comparisons (P-value ≤ 0.05, 1.5-fold change up or down). Only the top 30 comparisons are shown. For differential expression, a linear model was generated for every expressed miRNA, with miRNA expression as response variable and region as explanatory variable. Stage and patient were used as covariates to the statistical model. TMM normalized expression estimates were used as input for the modeling. miRNAs with fold change larger than 1.5 and P-value ≤ 0.05 were considered as differentially expressed. (B) Heatmap comparing the fold change of region X (center diagonal) to region Y (left and top) for two TE-embedded miRNA loci described in Figure 2. Only regions with significant fold changes are colored (P-value ≤ 0.05, 1.5-fold change).




