


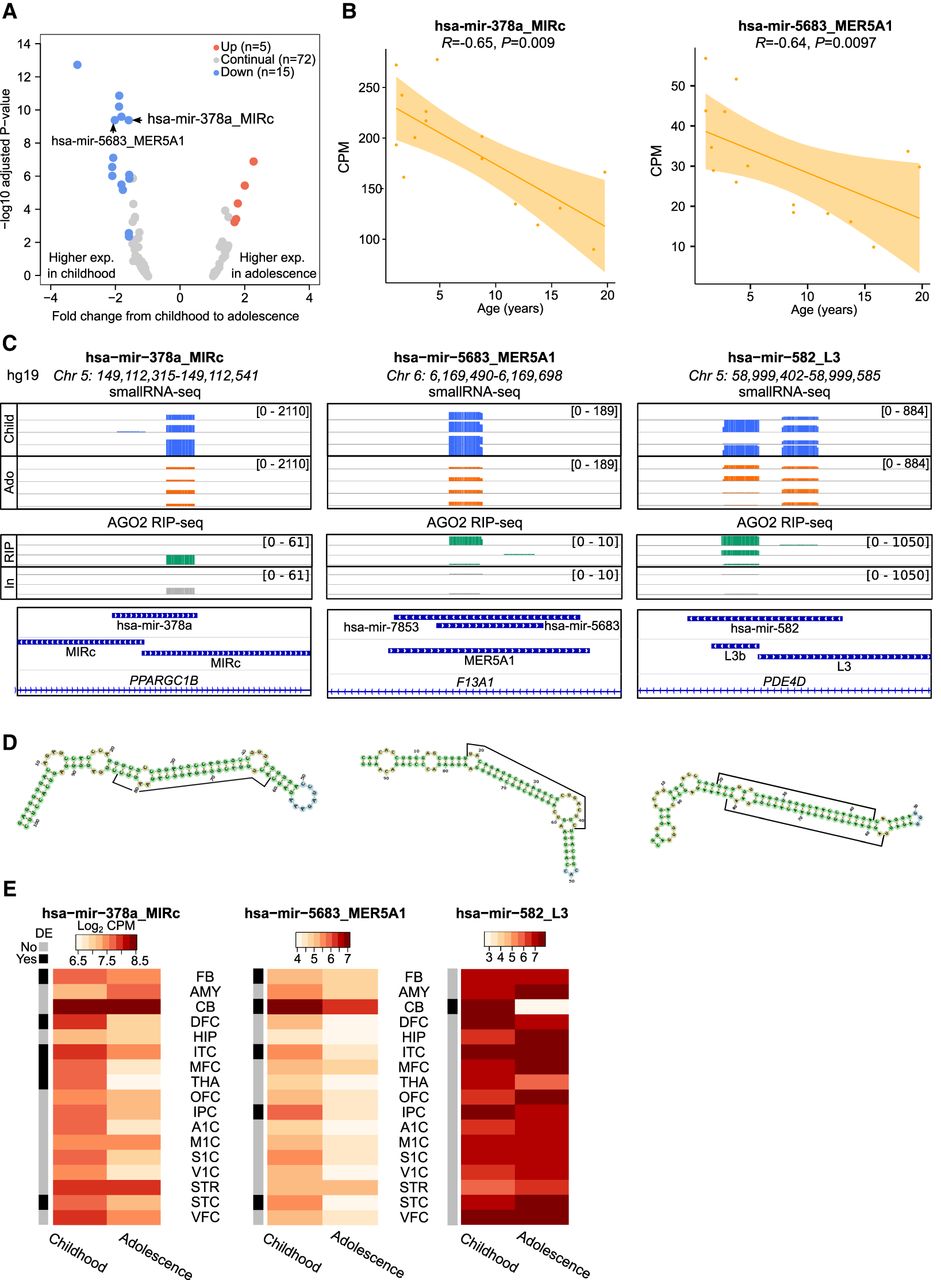
TE-embedded miRNAs are temporally expressed between child and adolescent human brains. (A) Volcano plot highlighting TE-embedded miRNAs significantly differentially expressed in FB (adjusted P-value ≤ 0.05, 1.5-fold change). (B) Dot plots showing the correlation of expression and age for specific TE-embedded miRNAs. Shaded area represents the variance. (C, top) Integrated genome viewer (IGV) visualization of four childhood (Child; blue) and four adolescent (Ado; orange) BAM files from DFC small RNA-seq data. (Middle) IGV visualization of three AGO2 RIP-seq (RIP; green) and three input (In; gray) BAM files from adult brain from Petri et al. 2019 (GSE106810). Read count is shown within square brackets. (Bottom) miRBase annotation, TE annotation, and gene annotations for hg19. (D) miRNA hairpin schematics from miRNAfold (Tempel and Tahi 2012; Tav et al. 2016) for the DNA sequences in C. Each hairpin structure exhibits 90% of verified miRNA hairpin features as previously defined (Tempel and Tahi 2012; Tav et al. 2016). Twenty-two bp peak sequences are highlighted by the black bars on arms of the hairpin. (E) Heatmaps showing regional expression in log2 counts per million (CPM), alongside differential expression results (black and gray bars). For differential expression, a linear model was generated for every expressed miRNA, with miRNA expression as response variable and stage as explanatory variable. TMM normalized expression estimates were used as input for the modeling. Region abbreviations are defined in Supplemental Figure S1.




