


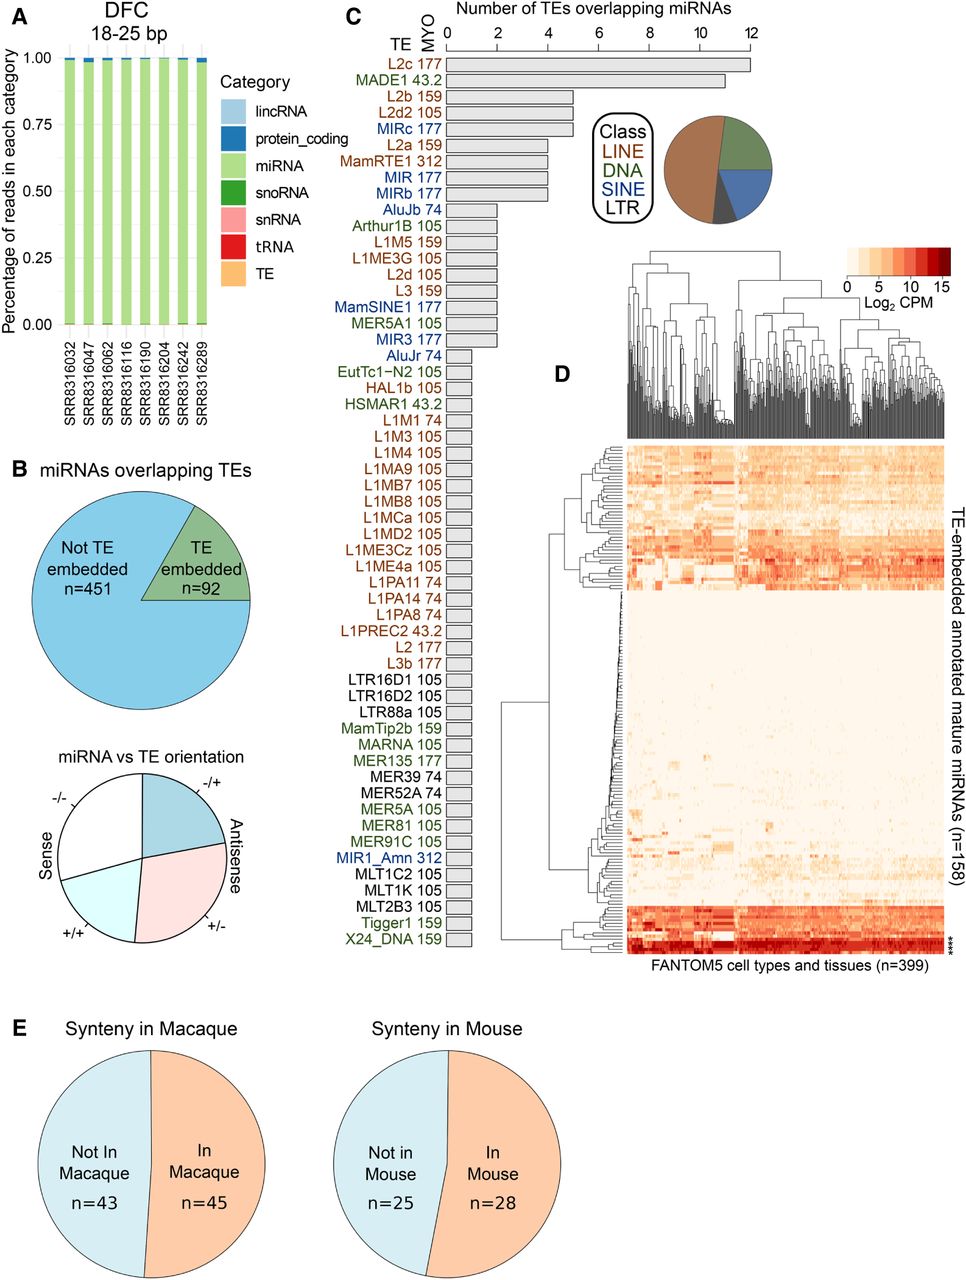
TEs contribute to annotated miRNAs in the child and adolescent human brain. (A) Stacked bar chart indicating the percentage of 18–25 bp reads overlapping different annotated genomic features for samples from the dorsolateral frontal cortex (DFC). If a TE overlaps an annotated feature (miRNA, tRNA, etc.) the feature takes preference. (B) Pie charts indicating the number of miRBase annotated miRNAs overlapping at least one TE (top), and their relative orientations (bottom). (C) Bar chart indicating the number of TEs overlapping miRBase annotated miRNAs and their class and age in million years old (MYO). (D) Expression in log2 counts per million+1 (CPM + 1) of mature TE-embedded miRNA in 399 cell types and tissues from FANTOM5 (De Rie et al. 2017). (*) Denotes miRNAs highlighted in the text. Samples comprise largely primary cells such as epithelial, fibroblast, endothelial, connective tissue, smooth muscle, immune, neural stem, dendritic, and pluripotent stem cells, among others (full list available in De Rie et al. 2017). (E) Pie charts indicating the number of human TE-embedded miRNAs detected in syntenic locations in macaque and mouse miRBase annotations (see also Supplemental Table S3 and Materials and Methods for detail).




