


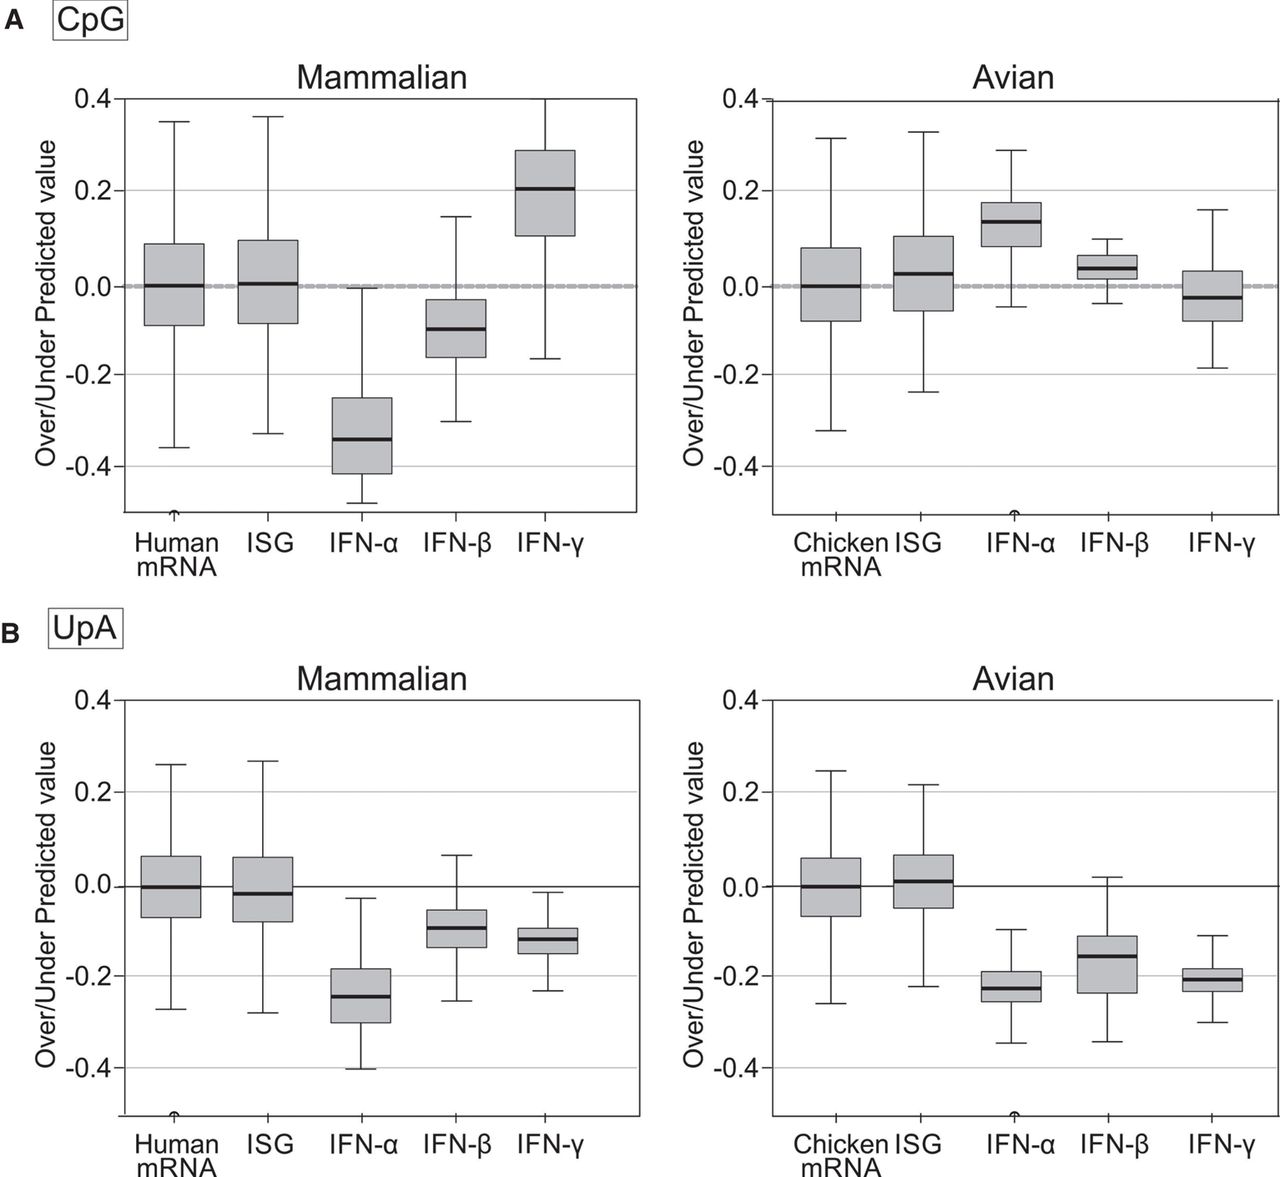
FIGURE 9.
Summary comparison of over- and underpresentation of (A) CpG and (B) UpA composition in mammalian and avian mRNA sequences and in ISG and IFN subsets. Observed/expected frequencies of CpG and UpA of gene sequences were compared to values predicted from their G + C content using regression formulae for line of best fit for human and chicken mRNA sequences (shown in Figs. 6, 8). Means values and ranges for overrepresentation (positive values) and underrepresentation (negative values) for each sequence are shown in Tukey plots; source listed in Supplemental Data Table S6.




