


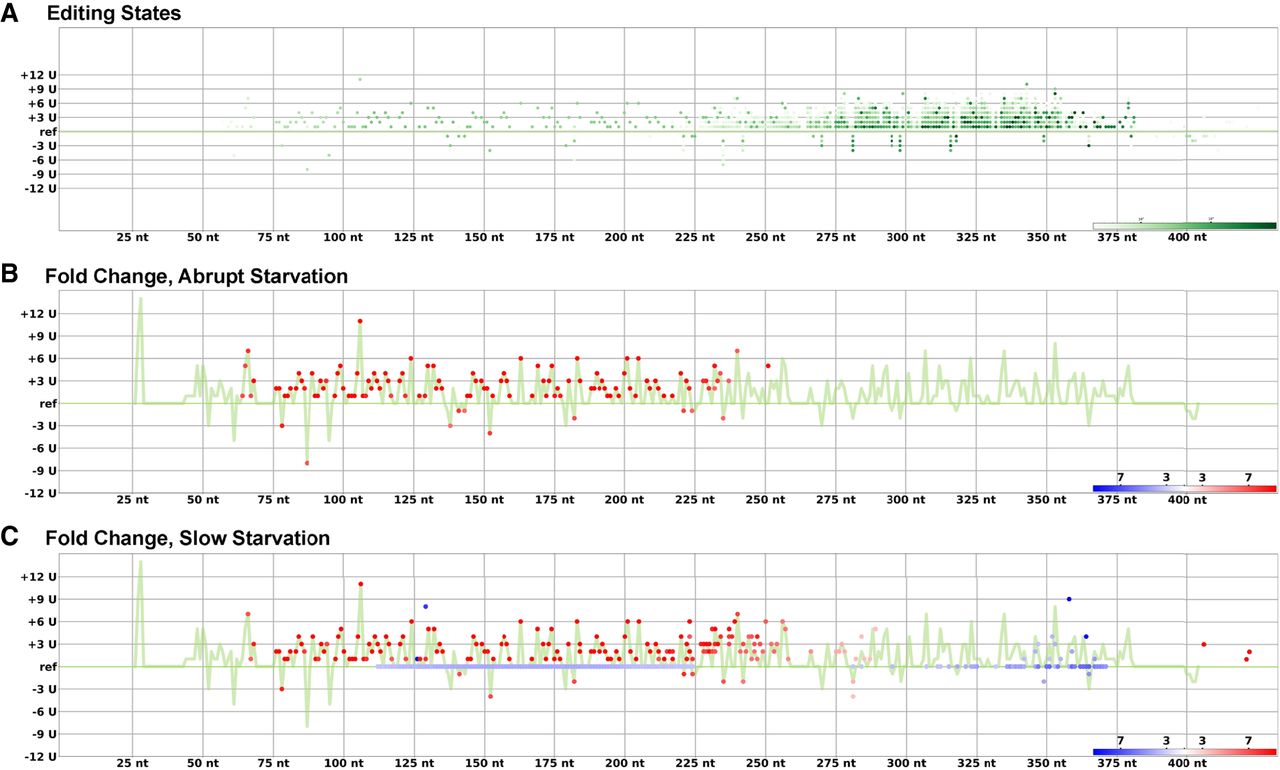
Differences in CO3 editing upon starvation of cultured Trypanosoma cruzi strain Sylvio X/10 epimastigotes. Each scheme represents the numbers of inserted/deleted U's as dots, located above (insertion) or below (deletion) the reference (ref) line, with the distance from neutral distinguishing the number of insertions or deletions. Each dot defines an editing state. The X-axis (in green) represents an A, G, or C nucleotide position in the maxicircle sequence for the CO3 cryptogene from 5′ to 3′ where editing can potentially occur. (A) Visualization of CO3 editing states found in at least two reads represented by dots on the matrix. The relative abundance of reads supporting an editing state is calculated for each site separately and is presented as the intensity of the green dot at that position. A more intense green color reflects a higher fraction of reads displaying that editing state. (B,C) Fold increase (red) or decrease (blue) of each specific editing event represented by positions on the CO3 transcript matrix for parasites abruptly starved of nutrients (B) or parasites allowed to gradually deplete medium nutrients over 8 d (C). The jagged green line shows the “path” of the canonical edited mRNA for the cryptogene, the number of U insertions or deletions at each editing site that will result in the canonical ORF.




