


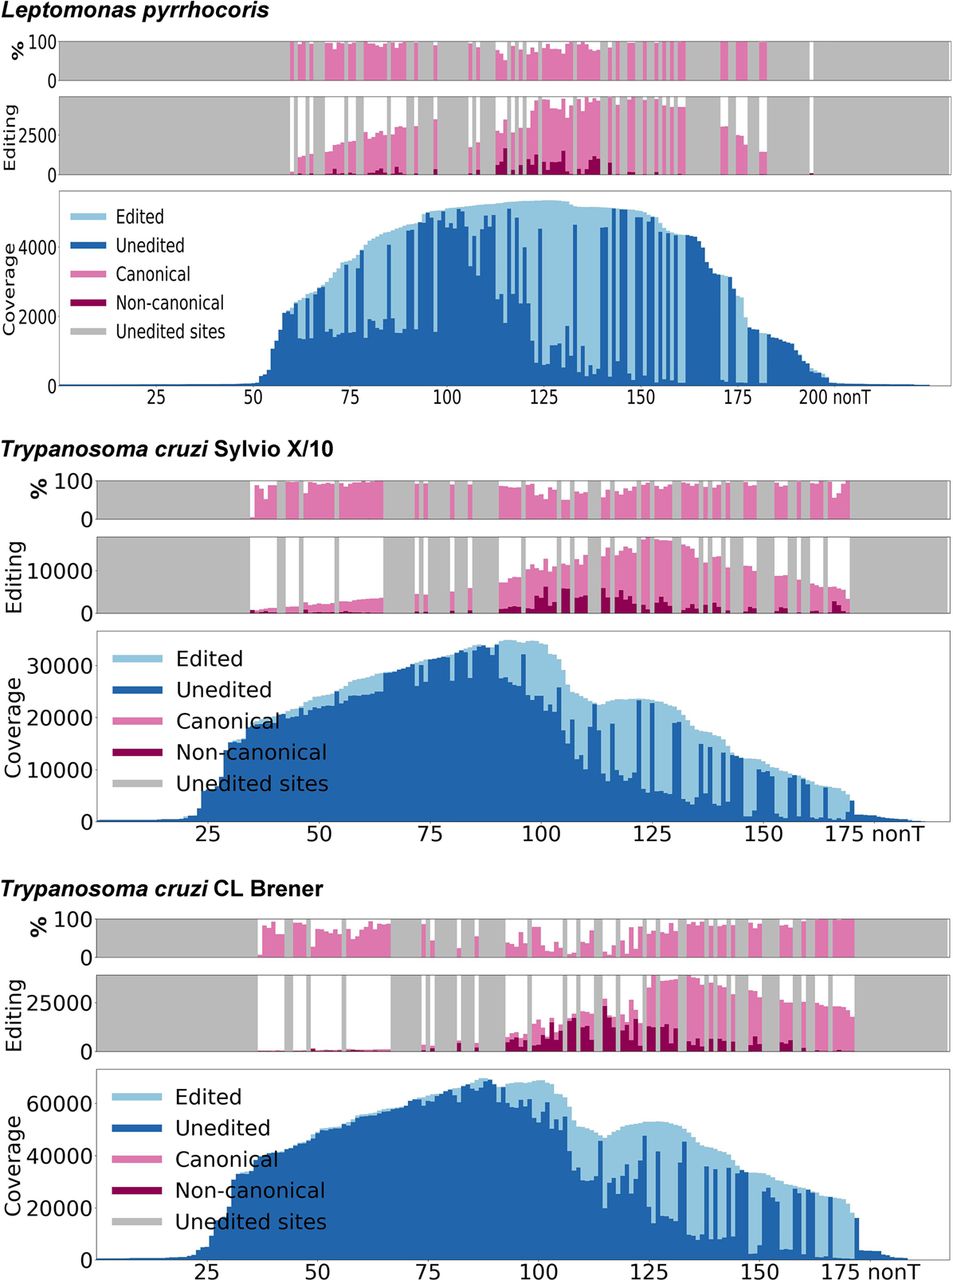
A lower percentage of RPS12 sites in Trypanosoma cruzi are edited, and a higher percentage of noncanonical editing states is present when compared with Leptomonas pyrrhocoris. Presented is editing of the RPS12 transcript for L. pyrrhocoris, T. cruzi Sylvio X/10, and T. cruzi CL Brener at every non “T” position from 5′ to 3′ along the X-axis. For each species/strain, the bottom plot depicts read coverage across the RPS12 transcript, with the portion of reads edited at each location along the transcript shown in a lighter blue tone. The middle plot is a bar plot with an X-axis consistent with the bottom coverage plot. At each editing site, the bar distinguishes the total number of reads in which an editing event at that site is observed and breaks down the number by canonical and noncanonical editing events. A, C, and G positions along the transcript that are not locations of editing for canonical edited sequence are blocked out in gray and not analyzed. The top plot shows a similar bar graph, but the Y-axis represents percentage of editing that is canonical rather than absolute numbers of reads possessing editing at each site.




